Payroll employment rises by 215,000 in July; unemployment rate unchanged at 5.3%
Last edited Fri Aug 7, 2015, 02:40 PM - Edit history (5)
Source: U.S. Bureau of Labor Statistics
Employment Situation Summary USDL-15-1515
Transmission of material in this release is embargoed until 8:30 a.m. (EDT) Friday, August 7, 2015
Technical information:
Household data: (202) 691-6378 • [email protected] • www.bls.gov/cps
Establishment data: (202) 691-6555 • [email protected] • www.bls.gov/ces
Media contact: (202) 691-5902 • [email protected]
THE EMPLOYMENT SITUATION -- JULY 2015
Total nonfarm payroll employment increased by 215,000 in July, and the unemployment rate was unchanged at 5.3 percent, the U.S. Bureau of Labor Statistics reported today. Job gains occurred in retail trade, health care, professional and technical services, and financial activities.
Household Survey Data
In July, both the unemployment rate (5.3 percent) and the number of unemployed persons (8.3 million) were unchanged. Over the year, the unemployment rate and the number of unemployed persons were down by 0.9 percentage point and 1.4 million, respectively. (See table A-1.)
....
In July, the number of long-term unemployed (those jobless for 27 weeks or more) was little changed at 2.2 million. These individuals accounted for 26.9 percent of the unemployed. Over the past 12 months, the number of long-term unemployed is down by 986,000. (See table A-12.)
The civilian labor force participation rate was unchanged at 62.6 percent in July, after declining by 0.3 percentage point in June. The employment-population ratio, at 59.3 percent, was also unchanged in July and has shown little movement thus far this year. (See table A-1.)
....
In July, 1.9 million persons were marginally attached to the labor force, down by 251,000 from a year earlier. (The data are not seasonally adjusted.) These individuals were not in the labor force, wanted and were available for work, and had looked for a job sometime in the prior 12 months. They were not counted as unemployed because they had not searched for work in the 4 weeks preceding the survey. (See table A-16.)
....
Establishment Survey Data
....
In July, average hourly earnings for all employees on private nonfarm payrolls rose by 5 cents to $24.99. Over the year, average hourly earnings have risen by 2.1 percent. Average hourly earnings of private-sector production and nonsupervisory employees increased by 3 cents to $21.01 in July. (See tables B-3 and B-8.)
The change in total nonfarm payroll employment for May was revised from +254,000 to +260,000, and the change for June was revised from +223,000 to +231,000. With these revisions, employment gains in May and June combined were 14,000 higher than previously reported. Over the past 3 months, job gains have averaged 235,000 per month.
_____________
The Employment Situation for August is scheduled to be released on Friday, September 4, 2015, at 8:30 a.m. (EDT).
Read more: http://www.bls.gov/news.release/empsit.nr0.htm
[center]Facilities for Sensory Impaired[/center]
Information from this release will be made available to sensory impaired individuals upon request. Voice phone: 202-691-5200, Federal Relay Services: 1-800-877-8339.
[center]Introduction[/center]
Good morning, Freepers and DUers alike. I especially welcome our good friends from across the aisle. You're paying for this information too, so I am absolutely delighted to have you participate in this thread. Please, everyone, put aside your differences long enough to digest the information. After that, you can engage in your usual donnybrook.
If you don't have the time to study the report thoroughly, here is the news in a nutshell:
Commissioner's Statement on The Employment Situation
It is easy to find one paragraph, or one sentence, or one datum in this report that will support the most outlandish of conclusions, from "the sky is falling" to "we'll have blue skies, nothing but blue skies, from now on." Easy, but disingenuous.
Every month, you can find something in the report that will cause you concern. One such nugget is the "labor force participation rate." Take the information in context. Consider not just this month’s data, but the trend.
Please take the time to look at progree's not-to-be-missed thread containing his thoughtful analysis, updated monthly. Here is the latest version:
Economy facts with links to official sources, rev 8/7/15.
Thank you so much for that, progree.
Let's begin with a couple of questions. Who is this Bureau of Labor Statistics, and why are they releasing all these numbers every month?
The BLS data must satisfy a number of criteria, including relevance to current social and economic issues, timeliness in reflecting today’s rapidly changing economic conditions, accuracy and consistently high statistical quality, and impartiality in both subject matter and presentation. To avoid the appearance of partiality, the dates of major data releases are scheduled more than a year in advance, in coordination with the Office of Management and Budget.
Note carefully those words: "accuracy," "quality," and "impartiality."
Full disclosure: I do not work for BLS, nor am I friends with anyone over there. I'm just someone who appreciates the work they do. My sole connection with the agency is that I've been in the building to pick up some publications.
[center]Household Survey vs. Establishment Survey[/center]
From the February 10, 2011, DOL Newsletter:
Secretary Solis answers three questions about how the Bureau of Labor Statistics calculates unemployment rates.
How does BLS determine the unemployment rate and the number of jobs that were added each month?
BLS uses two different surveys to get these numbers. The household survey, or Current Population Survey (CPS), involves asking people, from about 60,000 households, a series of questions to assess each person in the household's activities including work and searching for work. Their responses give us the unemployment rate. The establishment survey, or Current Employment Statistics (CES), surveys 140,000 employers about how many people they have on their payrolls. These results determine the number of jobs being added or lost.
[center]We Got the Beat.[/center]
July Jobs Report: Everything You Need to Know
Aug 7, 2015
Politics & Policy

—Associated Press
Yes, it’s that time again, folks. It’s “Jobs Friday,” when for one ever-so-brief moment the interests of Wall Street, Washington and Main Street are all aligned on one thing: jobs.
With the Labor Department set to release July’s employment report at 8:30 a.m. ET, focus on the numbers will be even more intense than usual. The Federal Reserve will be looking closely at this report and the one due out a month from now at their September policy meeting, where economists expect the first interest-rate increase since 2006.
Economists surveyed by The Wall Street Journal estimate nonfarm payrolls grew by 215,000 and the unemployment rate held steady at 5.3%.
Here at MoneyBeat HQ, we’ll crunched the numbers, track the markets and compile the commentary before and after the data crosses the wires.
-- -- -- -- -- -- -- -- -- -- -- -- -- -- -- -- -- -- --
You forgot to say "Enjoy the show" and "And while you’re here, why don’t you sign up to follow us on Twitter." Also, this blog used to be in the "Markets" section. Now it's in "Politics & Policy."
Before we do anything else, let's give credit to the workers behind the MoneyBeat blog:
The MoneyBeat Team:
Stephen Grocer
Editor
Phillipa Leighton-Jones
European Editor
Erik Holm
Deputy Editor
Maureen Farrell
Reporter, New York
Paul Vigna
Reporter, New York
David Cottle
Reporter, London
[font color="red"]Just added:[/font] Kristen Scholer
Reporter, New York
[font color="red"]Just added:[/font] Giles Turner
Reporter, London
MoneyBeat Columnists
Ronald Barusch
Dealpolitik
Francesco Guerrera
Current Account
Alen Mattich
Jason Zweig
The Intelligent Investor
Michael J. Casey
Horizons
E. S. Browning
There was this comment:

So far this year, growth in nonfarm payrolls has has averaged 208,000 a month. That’s a steady and respectable figure, though significantly below 2014?s 260,000 monthly average. Over the past five years, mean job growth is 190,000 a month. Stephen Stanley, chief economist at Amherst Pierpont Securities, says a figure in the low 200,000s is “more than enough to take up slack in the labor market.”
[center]The Large Print Giveth, and the Fine Print Taketh Away.[/center]
Long ago, a DU'er pointed out that, if I'm going to post the link to the press release, I should include the link to all the tables that provide additional ways of examining the data. Specifically, I should post a link to Table A-15. Alternative measures of labor underutilization. Table A-15 includes those who are not considered unemployed, on the grounds that they have become discouraged about the prospects of finding a job and have given up looking. Here is that link:
Table A-15. Alternative measures of labor underutilization
Also, hat tip, Recursion: How the Government Measures Unemployment
[font color="red"]New material: This link might not work for everyone. See progree's tips last month.[/font] ETA, on July 25, this link to an article in the July 20, 2015, issue of Barron's:
Refresher Course: Inside the Jobless Numbers
By Gene Epstein
July 18, 2015
The unemployment rate has never been the object of as much attention from the markets and the media as it is now, sparked by the keen interest taken in its monthly fluctuations by policy makers at the Federal Reserve.
Despite the heightened focus, there are a lot of misunderstandings and misconceptions about how the rate is calculated. Some people assume the Bureau of Labor Statistics compiles the rate from the unemployment-insurance rolls. On that basis, they fault the BLS for undercounting the unemployed. But that’s just one myth among many about this cornerstone measure of economic pain and labor-market slack.
To estimate the unemployment rate, the BLS actually relies on the monthly Current Population Survey conducted for it by the Census Bureau. While the data are highly imperfect in their own way, we think the Federal Reserve is right to view the official unemployment rate as the best available information, while also keeping its eye on ancillary measures of “labor underutilization.”
In fact, a close look at BLS methods suggests that, if anything, the official unemployment rate may be overcounting rather than undercounting the unemployed.

[center]Past Performance is Not a Guarantee of Future Results.[/center]
Nonetheless, what is important is not this month's results, but the trend. Let’s look at some earlier numbers:
ADP® (Automatic Data Processing), for employment in July 2015:
ADP National Employment Report: Private Sector Employment Increased by 185,000 Jobs in July
Bureau of Labor Statistics, for employment in June 2015:
Payroll employment rises by 223,000 in June; unemployment rate declines to 5.3%
ADP® (Automatic Data Processing), for employment in June 2015:
ADP National Employment Report: Private Sector Employment Increased by 237,000 Jobs in June
Bureau of Labor Statistics, for employment in May 2015:
Payroll employment rises by 280,000 in May; unemployment rate essentially unchanged (5.5%)
ADP® (Automatic Data Processing), for employment in May 2015:
ADP National Employment Report: Private Sector Employment Increased by 201,000 Jobs in May
Bureau of Labor Statistics, for employment in April 2015:
Payroll employment rises by 223,000 in April; jobless rate essentially unchanged (5.4%)
ADP® (Automatic Data Processing), for employment in April 2015:
ADP National Employment Report: Private Sector Employment Increased by 169,000 Jobs in April
Bureau of Labor Statistics, for employment in March 2015:
Payroll employment increases by 126,000 in March; unemployment rate unchanged at 5.5%
ADP® (Automatic Data Processing), for employment in March 2015:
ADP National Employment Report: Private Sector Employment Increased by 189,000 Jobs in March
Bureau of Labor Statistics, for employment in February 2015:
Payroll employment increases in February (+295,000); unemployment rate edges down to 5.5%
ADP® (Automatic Data Processing), for employment in February 2015:
ADP National Employment Report: Private Sector Employment Increased by 212,000 Jobs in February
[center]Nattering Nabobs of Negativism[/center]
[font color="red"]Revised material:[/font] Here’s a grim thought:
Fed economists: America’s missing workers are not coming back
By Max Ehrenfreund September 12 {2014}
A paper by Federal Reserve staff that will be discussed at the Brookings Institution on Friday {September 12, 2014} possibly hints at the central bank's thinking on interest rates and employment in advance of a consequential Fed meeting next week. The findings support [links:http://online.wsj.com/articles/fed-minutes-rate-hike-debate-heating-up-1408557628|hawks] on the Federal Open Market Committee, who feel that the Fed needs to prepare to raise rates sooner than expected, although the results are still being debated and might not persuade the committee's more dovish members.
The paper discusses the number of people who consider themselves part of the workforce -- including both people who have a job and those who are looking for work. It is a measure of the total manpower available in the U.S. economy. This number, the labor force participation rate, has been decreasing steadily since 2000. Americans who can't find work have been leaving the workforce, as have more and more retirees as the population ages.
Let’s follow that with another grim thought:
Why wage growth disparity tells the story of America's half-formed economic recovery
@chicoharlan
[email protected]
....
With unemployment down to 5.8 percent, the country’s half-formed recovery is often described with a convenient shorthand: We have jobs but little wage growth. But stagnancy is just an average, and for many Americans, the years since the financial crisis have pushed them farther from the line, according to a detailed analysis of government labor statistics by The Washington Post.
....
Among the winners in this climate: Older workers, women and those with finance and technology jobs. ... Among the losers: Part-timers, the young, men, and those in the health, retail and food industries.
....
Chico Harlan covers personal economics as part of The Post's financial team.
Dissenters, take note:
A New Reason to Question the Official Unemployment Rate
AUG. 26, 2014
The Labor Department’s monthly jobs report has been the subject of some wacky conspiracy theories. None was wackier than the suggestion from Jack Welch, the former General Electric chief executive, that government statisticians were exaggerating job growth during President Obama’s 2012 re-election campaign. Both Republican and Democratic economists dismissed those charges as silly.
But to call the people who compile the jobs report honest, nonpartisan civil servants is not to say that the jobs report is perfect. The report tries to estimate employment in a big country – and to do so quickly, to give policy makers, business executives and everyone else a sense of how the economy is performing. It’s a tough task.
And it has become tougher, because Americans are less willing to respond to surveys than they used to be.
A new academic paper suggests that the unemployment rate appears to have become less accurate over the last two decades, in part because of this rise in nonresponse. In particular, there seems to have been an increase in the number of people who once would have qualified as officially unemployed and today are considered out of the labor force, neither working nor looking for work.
[center]On the Road Again[/center]
The DOL Newsletter - October 6, 2011
Have an iPhone, iPod Touch or Android phone? Now you can access the latest labor data and news from the department's Bureau of Labor Statistics and Employment and Training Administration in the palm of your hand. The latest free mobile app displays real-time updates to the unemployment rate, Unemployment Insurance initial claims, the Consumer Price Index, payroll employment, average hourly earnings, the Producer Price Index, the Employment Cost Index, productivity, the U.S. Import Price Index and the U.S. Export Price Index in real time, as they are published each week, month or quarter. News releases providing context for the data can also be accessed through the app and viewed within a mobile browser or as PDF documents.
US Labor Department launches economic and employment statistics app
WASHINGTON — The most up-to-date employment data and economic news releases from the U.S. Department of Labor's Bureau of Labor Statistics and its Employment and Training Administration now can be viewed using a new mobile application.
....
The new app is currently available for the iPhone and iPod Touch as well as Android phones. The Labor Department is working to develop versions for BlackBerry and iPad devices. Visit http://m.dol.gov/apps/ to download this and other mobile apps.
Download the Data, Other Mobile Apps
[center]A Few More Things[/center]
[font color="red"]New material:[/font] Every month, someone will cite the labor force participation rate as a cause for concern. This July 2014 report from the Council of Economic Advisers addresses that:
THE LABOR FORCE PARTICIPATION RATE SINCE 2007: CAUSES AND POLICY IMPLICATIONS
(Hat tip, Adrahil: Look deeper.)
Meet FRED, every wonk’s secret weapon
By Todd C. Frankel August 1, 2014
FRED stands for Federal Reserve Economic Data. It serves as an online clearinghouse for a wealth of numbers: unemployment rates, prices of goods, GDP and CPI, things common and obscure. Today, FRED is more than a little bit famous, thanks to the public’s fascination with economic data.
Federal Reserve Economic Data
So how many jobs must be created every month to have an effect on the unemployment rate? There's an app for that:
Federal Reserve Bank of Atlanta Jobs Calculator™
(Note new link for Jobs Calculator™. Hat tip, progree.)
Monthly Employment Reports from BLS
The U.S. Census Bureau has its own releases:
U.S. Census Bureau Latest News
U.S. Census Bureau Economic Indicators
For people who need a daily fix:
BLS-Labor Statistics Twitter feed
Read tomorrow's news before it happens. The schedule for all economic reports:
MarketWatch Economic Calendar
 = new reply since forum marked as read
Highlight:
NoneDon't highlight anything
5 newestHighlight 5 most recent replies
= new reply since forum marked as read
Highlight:
NoneDon't highlight anything
5 newestHighlight 5 most recent replies

BumRushDaShow
(128,911 posts)and thanks for the update! 
I noticed this week that my area had a sudden uptick in infrastructure work (roads, underground utilities, etc) and even housing starts (in the city of all places). Am guessing more contracts were awarded over the summer to start work in July/August to try to get as much done as can be done before December when the weather starts to interfere. It seems to be mirroring the 2009 stimulus era levels in terms of construction.

jwirr
(39,215 posts)
whatthehey
(3,660 posts)The Census Bureau does that one and if memory serves we are about due for 2014 data. But yes 2013 was noticeably better than 2012 and since the rate is strongly correlated to UE there is no reason to expect anything but continued and likely accelerated reduction in 2014.
jwirr
(39,215 posts)jobs that are not keeping up with the cost of living. What do you think workers are demanding hire minimum wages for?
And those kind of jobs do not get you out of poverty. Most of the people getting those jobs are still eligible for food stamps and other programs. Job or no job they are still in poverty and they cannot afford the higher cost of living that is happening across the country.

progree
(10,904 posts)If you are going to spread RW memes here at DU, at least cite your source.
Here is the real INFLATION ADJUSTED hourly earnings of production and non-supervisory employees. Better than under G.W. Bush. Better than under Clinton.
http://data.bls.gov/timeseries/CES0500000032

If you don't like inflation-adjusted, here are the actual dollar figures:
http://data.bls.gov/timeseries/CES0500000008

mahatmakanejeeves
(57,427 posts)From today's report:
....
In July, average hourly earnings for all employees on private nonfarm payrolls rose by 5 cents to $24.99. Over the year, average hourly earnings have risen by 2.1 percent. Average hourly earnings of private-sector production and nonsupervisory employees increased by 3 cents to $21.01 in July. (See tables B-3 and B-8.)
Response to jwirr (Reply #2)
Post removed
jtuck004
(15,882 posts)kept low by having millions of people who want jobs not counted, such as here, poverty can be kept low by using false values for housing, food, fuel, etc.
Which is exactly what is happening. You will notice the numbers dropped a bit for the last couple years, as if moving people from poverty to near poverty makes any difference in their lives at all.
The latest info makes it sound like the next count will be up again. We don't count them very often because that would be embarrassing, to see how many people have been thrown in the trash to make the economy look better.
There are more millions more people in poverty and on food stamps than there were at the beginning of this administration. They are left hanging along with people who might get the color-blind government jobs, to keep the wealthy pumped up for the other 300 million Americans.
It is detailed in Timothy "Killer" Geithner's book Stress Test, where it explains why it is important to make sure bank%ter/donors are kept healthy even if it is at the cost of a few million people left in poverty, a few hundred thousand hungry kids, because "it is good for you".
You can watch voters laugh AT his thieving face here as he tried to spin it otherwise.
progree
(10,904 posts)[font color = blue]>>Much like unemployment is kept low by having millions of people who want jobs not counted, such as here, <<[/font]
Sigh, here we go again.
Here is another take on it where he thinks we're over-counting the unemployment rate.
Inside the Jobless Numbers, by Gene Epstein, 7/18/15
http://online.barrons.com/articles/refresher-course-inside-the-jobless-numbers-1437195186
If you want a broader measure of unemployment, here is U-6, that counts everyone who says they want a job and has looked sometime, even just once in the past year (plus part-timers who want full-time work):
http://data.bls.gov/timeseries/LNS13327709
Series Id: LNS13327709
Seasonally Adjusted
Series title: (seas) Total unemployed, plus all marginally attached workers plus total employed part time for economic reasons, as a percent of all civilian labor force plus all marginally attached workers
Labor force status: Aggregated totals unemployed
Type of data: Percent or rate
Age: 16 years and over
Percent/rates: Unemployed and mrg attached and pt for econ reas as percent of labor force plus marg attached

I credit the Obama administration for bringing it down from where it was (and I blame Bush for the huge increase). But then I'm just a libtard I guess.
(the official unemployment rate, U-3, counts only those who have looked sometime, even just once, in the past 4 weeks).
jtuck004
(15,882 posts)Go do some homework. You really have no idea how funny this sounds.

Another 640,000 Drop Out of the Labor Force Causing Unemployment Rate Decline - http://www.economicpopulist.org/content/another-640000-drop-out-labor-force-causing-unemployment-rate-decline-5778
And, I don't guess I can ever type this slow enough...
Go tell someone else your fantasy. I have to live in the real world.
progree
(10,904 posts)Last edited Fri Aug 7, 2015, 12:44 PM - Edit history (1)
[font color = blue]>>Wow.You have never read the way this is actually calculated. Here.
http://www.bls.gov/cps/cps_htgm.htm
Go do some homework. You really have no idea how funny this sounds. <<[/font]
Instead of pathetic juvenile gratuitous insults that says a lot more about you than me.
Again, they only count people who have looked for work in the past 4 weeks as being in the labor force. In the U-6 unemployment measure (graphed in my #8 above) they count anyone who has looked for work, even just once, in the past year. And its been measured that way for decades.
A lot of people ideally want a great job if it came along, but aren't actually looking for work. Particulary with the growing wave of aging baby boomers who are semi-retired.
[font color = blue]>>I have to live in the real world. <<[/font]
LOL, sure doesn't sound like you are.
jwirr
(39,215 posts)want us to be. Jobs increase every quarter and have little or no effect on a lot of us but oh, well that stats look good.
We used to say no one was talking about poverty anymore - I think it is more than that they do not care about those in poverty so why bother to talk about it.
whatthehey
(3,660 posts)"Poverty is falling" or "Near Poverty is falling" does not mean, imply or even hint that no-one is poor or struggling. In fact both statements assume that fact, since if they were at zero, they couldn't be falling at all.
But most of us would agree that those things falling is better than the alternative.
A leg in a cast after a compound fracture still hurts, and still won't work like the leg of an elite athlete, but it's better than it was with the tibia sticking out of the skin on a filthy roadside, and that's the direction that we need to acknowledge. Improvement and perfection are distinct concepts.
whatthehey
(3,660 posts)jtuck004
(15,882 posts)a choice between thieving landlords and food because of the changes in the housing market - read around here. If you really care.
The change in the numbers is statistically insignificant, and as with unemployment, shows a much more positive light to suit the politicians, but it doesn't reflect the misery these folks are living in.
whatthehey
(3,660 posts)And when 15% falls to 14.5% there is no measure by which it is statistically insignificant. That's a 3.3% drop. Reflecting over 1.5 million people.
Aggregate numbers do not, cannot and are not intended to reflect individual circumstances. They are there to measure society-wide trends, and they show steady improvement on that basis.
These rates are measures in the same way under strict protocols by hordes of people, doubtless of all political stripes, not one of whom has raised a red flag about doctored numbers to make Obama look good. If you think the current levels are manipulated, then so were previous benchmarks. It's still a relative measure showing improvement.
jtuck004
(15,882 posts)People have raised red flags about this crap for years. There is even an alternative since this doesn't do a very good job of counting, being based on 100 year old equations of poverty.
And when 15% falls to 14.5% there is no measure by which it is statistically insignificant. That's a 3.3% drop.
Go waste someone else's time.

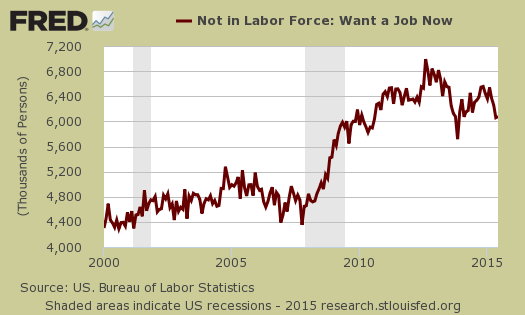
joshcryer
(62,270 posts)People who want to work but can't find a job.
jtuck004
(15,882 posts)whatthehey
(3,660 posts)jtuck004
(15,882 posts)can sit at the big table with the rest of us who already have.
Go read - I haven't the time to watch you.
mahatmakanejeeves
(57,427 posts)You can adjust the timeline on the x-axis to measure from 2000 to 2015.
In my cubicle and not at any table....
progree
(10,904 posts)jtuck004
(15,882 posts)25 million people in front of them. Not to mention years they spent looking and not finding. And when the do get one the vast majority are shit jobs, barely suitable for humans, and with a guarantee they will be looking again in a year or two.
Just know - you are talking about people who are posting here who have not been able to find anything, or who are now working shit jobs after this administration decided it needed to make bank$ter/donors riches on the backs of those with the least. According to Geither's book, anyway.

Igel
(35,300 posts)But they haven't bothered to apply, they've said that if offered a job they couldn't take it, or a number of other reasons are offered for not being counted as "unemployed."
That's an easy status to fall into, "unemployed." Put in a job application once a month, for example.
This is one of the more difficult numbers to make use of. Yeah, they don't have a job. Yeah, they want a job. For for any of a lot of reasons, they either can't take a job or haven't done the minimum necessary to move their chances of being offered a job from 0 to something that's greater than 0.
I've personally spent time in that category. A lot of time. For different reasons. I wanted a job, was discouraged, didn't know where to apply. Had no reliable transportation and lived close to nothing. There were also a whole lot of jobs which, if offered, I'd have said 'no' to. Or I wanted a job, but wasn't sure where I'd fit in the time--so either I was convinced there was no possible job or I was so busy doing non-job things that there was no way to work more than 2-3 hours/week. I knew other people in those categories. How large these categories are I can't say. BLS doesn't say.
At the same time my MIL lives 30 miles from nowhere, doesn't want to drive to any job, had erratic hours and refused a number of jobs. She was discouraged and her health wouldn't let her take a wide range of jobs. She was 70+, and that tends to get you a lot of rejections. Yet she managed to find a long-distance job and put in from 10-40 hours/week, depending on the week and her schedule.
Ah, the power of anecdotes.
So, yeah. 6 million. Whatever that actually means.
joshcryer
(62,270 posts)Along with marginally attached workers it falls around 1/3rd of the rest of the people who want to work.
"Total not in the labor force" includes children, disabled, retired, homeless, people who don't want to work, moochers, whatever.
progree
(10,904 posts)So what? Young adults are students until they're 22-24 at times.
progree
(10,904 posts)"not in the labor force" statistic.
joshcryer
(62,270 posts)But I guess a good old Republican would want them back to work.
Response to joshcryer (Reply #45)
progree This message was self-deleted by its author.
Response to joshcryer (Reply #45)
progree This message was self-deleted by its author.
mahatmakanejeeves
(57,427 posts)Last edited Sat Aug 8, 2015, 11:20 AM - Edit history (2)
Linked from the BLS twitter feed.
Charting the labor market: Data from the Current Population Survey (CPS) August 7, 2015
It's hard to cut and paste these from the BLS .pdf format document. Later today, if it hasn't done so already, The Wall Street Journal. will present the charts in a format that does permit copying them and pasting them here.
BLS just added another .pdf document:
Current Employment Statistics Highlights
joshcryer
(62,270 posts)
mahatmakanejeeves
(57,427 posts)If it weren't for the replies, this thread would be nothing. I really appreciate the work posters to this thread do. They have heightened expectations of themselves, and they show this by citing, for the most part, authoritative sources, as opposed to sites that urge visitors to stock up on canned goods or colloidal silver for the bunker.
I never pressure posters to or readers of this thread to drink any flavor of Kool-Aid. They can think anything they want. My policy is, to quote one of this country's most despised presidents, "For here we are not afraid to follow truth wherever it may lead, nor to tolerate any error so long as reason is left free to combat it."
I can't emphasize too strongly that the Bureau of Labor Statistics, the Census Bureau, and the Bureau of Economic Analysis are not political agencies. Obviously the workers there have opinions, but when they are on the job, neither are they working for a politician, nor are they working for any political party. They are working for the American people.
My hat is off to all of you.
mahatmakanejeeves
(57,427 posts)By David Harrison
U.S. employers added a seasonally adjusted 215,000 jobs in July, while the unemployment rate held at 5.3%, the Labor Department said Friday. Economists surveyed by The Wall Street Journal had forecast a gain of 215,000 jobs and a 5.3% unemployment rate.
....
$24.99
Average hourly earnings of private-sector workers rose 0.2% to $24.99 in July. Over the past year, wages have risen 2.1%, on par with the pace of much of the expansion. Economists and Federal Reserve officials have been closely monitoring wage growth for indications that the labor market has tightened following years of job creation. A pickup in wage growth could be a sign that the economy is nearing full employment and could make central bank officials more confident in a September increase in interest rates. July’s report suggests payrolls continue to creep up even though they still have a way to go.
62.6%
The labor-force participation rate stayed the same last month at 62.6%, suggesting there remains quite a bit of slack in the labor market. The participation rate–the share of the population either working or actively looking for work–has been dropping for several years and currently stands at levels last seen in 1977. That’s partly because baby boomers are retiring in droves but also because discouraged unemployed workers are dropping out of the labor force. Economists have been looking for some improvement in the participation rate as a sign that the labor market has improved enough to draw discouraged workers back in.
5,000
Mining employers shed 5,000 jobs in July as the effects of low oil and coal prices continue to ripple across the industry. So far this year mining has lost 78,000 jobs. Employment increases in July were driven by health care, which added 28,000 and professional and technical services, which grew by 27,000. July also saw an uptick of 17,000 jobs in financial services and 15,000 in manufacturing. Bars and restaurants created 29,000 new positions and transportation and warehousing employers boosted payrolls by 14,000.
mahatmakanejeeves
(57,427 posts)I know; I know.
July jobs report – 215,000 jobs added, U-3 unchanged at 5.3%
{from the comments}
The biggest revision may well come in May 2017 when the BLS Establishment Survey for April 2015-March 2016 is benchmarked against the Quarterly Census of Employment and Wages. The 12/2013-12/2014 delta between the QCEW and Establishment Survey, which is typically in the 50,000 range in favor of the Establishment Survey as the QCEW doesn’t count those employed in jobs that are not covered by unemployment insurance, is currently somewhere north of 500,000.
Steve Eggleston on August 7, 2015 at 11:05 AM
candelista
(1,986 posts)The BLS reports that 93,770,000 people (16 and older) were neither employed last month nor had made specific efforts to find work in the prior four weeks.
The number of people outside the workforce in July increased 144,000 over June’s record when 93,626,000 were not in the workforce.
July’s labor force participation rate however remained the the same as June at 62.6 percent. Before last month the labor force participation rate had not been that low since October 1977, when the participation rate was 62.4 percent.
http://www.bls.gov/news.release/empsit.t01.htm
mahatmakanejeeves
(57,427 posts)The number of people not in the labor force reached another record high in July, according to new jobs data released Friday by the Bureau of Labor Statistics.
The BLS reports that 93,770,000 people (16 and older) were neither employed last month nor had made specific efforts to find work in the prior four weeks.
The number of people outside the workforce in July increased 144,000 over June’s record when 93,626,000 were not in the workforce.
July’s labor force participation rate however remained the the same as June at 62.6 percent. Before last month the labor force participation rate had not been that low since October 1977, when the participation rate was 62.4 percent.
That material comes word for word from Breitbart, not the BLS news release.
candelista
(1,986 posts)It's all there. Let your fingers do the walking. And why are you reading Breitbart?
progree
(10,904 posts)and some who quit working shitty jobs just for the health benefits, now that affordable insurance is available.
How many of those 93,770,000 want a job and made any effort to look for one in say the past year (which is measured by U-6, which is graphed in #8)?
WhoWoodaKnew
(847 posts)It's like a Republican cry-fest every time. Heck, it's almost identical to what the Republicans say EVERY time.
progree
(10,904 posts)Over the past 3 months, employment gains have averaged 235,000 per month. Over the past year, payroll employment has increased by 2,915,000 (an average of 243,000/month). And since the jobs recovery began in March 2010, payroll employment increased by 12,422,000.
The numbers in the below paragraphs come from the Household Survey, which is different from the Establishment Survey that produces the payroll employment number.
(Monthly change figures in the Household Survey are probably best ignored due to volatility caused by statistical noise. That's true in both "good" months and in "bad" months. However, over longer periods of time like a year or more, the monthly zigs and zags will have somewhat averaged out and a more statistically valid trend will emerge.
In particular, year-over-year (12 months) figures should be much better statistically because the current month is being compared to the same month last year, e.g. July vs. July of a year before, and therefore there should be much less error in the seasonal adjustment process -- as both will be adjusted by the same seasonal adjustment factor, and so will cancel out in the comparison. )
[font color = brown] ----------------------------------------------------------------------
Table A-1 and other tables can be found at the all-tables full jobs report at http://www.bls.gov/news.release/pdf/empsit.pdf, or gotten one-at-a-time from the bottom section of http://www.bls.gov/news.release/empsit.nr0.htm. For example, Table A-9 alone is at http://www.bls.gov/news.release/empsit.t09.htm )
----------------------------------------------------------------------[/font]
Many numbers were good or improved in July
BLS's broadest measure of unemployment -- U-6 -- decreased by 0.1% to 10.4%. It includes in its version of the "labor force" everyone who has looked for a job in the last 12 months (even if just once). And it includes part-timers wanting full-time work. So this is just plain good news. (Unlike the official unemployment rate -- which counts only those who have looked for work in the last 4 weeks as unemployed).
Part-time workers who want full-time work fell by 180,000. It has fallen by 1,108,000 over the past 12 months
The Employed increased 101,000 in July. (LNS12000000) (Remember this is the Household Survey, a separate survey from the Establishment survey that produced the +215,000 payroll employment figure. The Household Survey is much more volatile and less reliable than the Establishment survey. Anyhoo, the Employed has increase by 2,439,000 over the last 12 months.
Full-time workers increased by 536,000 in July. This is a volatile data series. You will not see any threads extolling this great increase in full-time workers. (But we sure saw a lot of posts last month by our good friends on the right and their DU allies making a big hoo-hah about the 349,000 drop in full-time workers in June).
Over the past 12 months, full-time workers increased by 3,141,000 (262,000/mo average). And since the jobs recovery began, it has increased by 10,811,000.
Many numbers were not-so-good or bad in July
The official unemployment rate (U-3) remained unchanged at 5.3%.
The labor force increased a modest 69,000 -- consisting of 101,000 more employed and 33,000 fewer unemployed. In the last 4 months it has increased by only 200,000 (50,000/month average). But over the past 12 months it has grown by 1,058,000. (LNS11000000) .
The labor force participation rate remain unchanged at 62.6%, its lowest level since the mid-1970's.
===========================================
Some key numbers from the Household Survey (note the Household Survey is different from the Establishment Survey that produces the payroll employment of the first paragraph). See below, and see Table A-1 for the main Household Survey numbers - http://www.bls.gov/news.release/empsit.t01.htm
Exception: the payroll employment numbers and the inflation-adjusted weekly earnings come from the Establishment Survey. I don't include the over-the-last-month figure for inflation-adjusted weekly earnings, because the CPI data needed for the inflation adjustment is not available until later in the month; but I do include them for the longer periods (over the last year and since the payroll employment recovery began)
In the below tables, all "%" ones are percentage point changes, *not* percent increases or decreases. FOR EXAMPLE, when you see something like this:
+0.1% Unemployment rate
It means that the unemployment rate increased by 0.1 percentage points (this EXAMPLE is from May 2015 when the unemployment rate rose from 5.4% to 5.5%). This is an increase of 0.1 percentage points, *not* a 0.1% increase. The corresponding percent increase is (5.5-5.4)/5.4 X 100% = +1.9%, i.e. a 1.9% increase. So in summary, IN THIS EXAMPLE, the unemployment rate increased by 0.1 percentage points, and also increased 1.9%.
[font color=blue]OVER THE LAST MONTH[/font]:
== ESTABLISHMENT SURVEY ==
+215,000 Nonfarm Payroll Employment ( CES0000000001 )
== HOUSEHOLD SURVEY (warning: this survey's monthly change figures are very statistically noisy) ==
+69,000 Labor Force (employed + jobless people who have looked for work sometime in the last 4 weeks)
+101,000 Employed
-33,000 Unemployed (jobless people who have looked for work sometime in the last 4 weeks)
+0.0% Employment-To-Population Ratio aka Employment Rate (it's at 59.3%)
+0.0% LFPR (Labor Force Participation rate) (to 62.6%)
+0.0% Unemployment rate (at 5.3%). Is Unemployed (as defined above) / Labor Force [N864.HM].
-0.1% U-6 unemployment rate (to 10.4%) http://data.bls.gov/timeseries/LNS13327709
-180,000 Part-Time Workers who want Full-Time Jobs (Table A-8's Part-Time For Economic Reasons)
-402,000 Part-Time Workers (Table A-9)
+536,000 Full-Time Workers (Table A-9)
^--Monthly change figures in the Household Survey are probably best ignored due to volatility caused by statistical noise. That's true in both "bad" months and in "good" months
[font color=blue]OVER THE LAST YEAR (last 12 months)[/font]:
==== ESTABLISHMENT SURVEY ====
+2,915,000 Nonfarm Payroll Employment (Establishment Survey, CES0000000001)
+2.09% INFLATION ADJUSTED Weekly Earnings of Production and Non-Supervisory Workers ( CES0500000031 )
......... the weekly earnings percentage is 11 months thru June because no CPI data for July yet
==== HOUSEHOLD SURVEY ========
+1,058,000 Labor Force
+2,439,000 Employed
-1,382,000 Unemployed
+0.3% Employment-To-Population Ratio aka Employment Rate
-0.3% LFPR (Labor Force Participation rate)
-0.9% Unemployment rate
-1.8% U-6 unemployment rate (fabulous. it includes anyone that looked for work even once in the past year)
-1,108,000 Part-Time Workers who want Full-Time Jobs (Table A-8's Part-Time For Economic Reasons)
-725,000 Part-Time Workers (Table A-9)
+3,141,000 Full-Time Workers (Table A-9)
The reason there's no data for July yet for the Weekly Earnings is because the CPI inflation adjustment number for July is not yet available.
All the "over the last year" numbers are really good numbers except the Labor Force Participation Rate shows a 0.3% decrease. Interesting though that there was a 0.3% percentage point increase in the Employment To Population Ratio. The Population being talked about is the civilian non-institutional population age 16 and over, yes, including all elderly people, even centenarians.
Seems to me that there is too much discussion in the media of the Labor Force Participation Rate (the employed plus the jobless people who have looked for work in the last 4 weeks, all divided by the population), and not enough attention to what seemingly matters more -- the Employment to Population Ratio. Why aren't we celebrating the increase in the percentage of the population that is employed (the employment to population ratio)-- a figure that has been slowly moving up since the job market bottom, despite the growing wave of baby boomer retirements?
[font color=blue]SINCE THE PAYROLL EMPLOYMENT RECOVERY BEGAN -- Last 65 months thru July 31, 2015: 7'15 - 2'10[/font]:
(This is the period from when continuous growth of payroll employment began, thru July 31, 2015)
==== ESTABLISHMENT SURVEY ====
+12,422,000 Nonfarm Payroll Employment (Establishment Survey, CES0000000001)
+3.41% INFLATION ADJUSTED Weekly Earnings of Production and Non-Supervisory Workers ( CES0500000031 )
......... the weekly earnings percentage is thru June 2015 because no CPI data for July yet
==== HOUSEHOLD SURVEY ====
+3,412,000 Labor Force
+10,259,000 Employed
-6,847,000 Unemployed
+0.8% Employment-To-Population Ratio aka Employment Rate (woo hoo!)
-2.3% LFPR (Labor Force Participation rate) (ughh)
-4.5% Unemployment rate
-6.6% U-6 unemployment rate
-2,611,000 Part-Time Workers who want Full-Time Jobs (Table A-8's Part-Time For Economic Reasons)
-362,000 Part-Time Workers (Table A-9)
+10,811,000 Full-Time Workers (Table A-9)
[font color=blue]Part-Time Workers Who Want Full Time Jobs, as % of All Employed[/font]
[div style="display:inline; font-size:1.37em; font-family:monospace; white-space:pre;"]Jul'14 Apr'15 Jun'15 Jul'15
[div style="display:inline; font-size:1.37em; font-family:monospace; white-space:pre;"]5.1% 4.4% 4.4% 4.2%
A graph of part-time and full-time workers (this is through June 2015)

CLARIFICATION: in the above, these are part-time workers and full-time workers, not part-time jobs and full-time jobs.
This excellent post from early July show two perspectives of the trends in part-time workers and full-time workers (not part-time jobs and full-time jobs). Thanks mahatmakanejeeves
http://www.democraticunderground.com/10141134306#post12
The links to the data above
# Nonfarm Payroll Employment (Establishment Survey, http://data.bls.gov/timeseries/CES0000000001
# INFLATION ADJUSTED Weekly Earnings of Production and Non-Supervisory Workers http://data.bls.gov/timeseries/CES0500000031
# Labor Force http://data.bls.gov/timeseries/LNS11000000
# Employed http://data.bls.gov/timeseries/LNS12000000
# Unemployed http://data.bls.gov/timeseries/LNS13000000
# Employment-To-Population Ratio aka Employment Rate http://data.bls.gov/timeseries/LNS12300000
# LFPR (Labor Force Participation rate) http://data.bls.gov/timeseries/LNS11300000
# Unemployment rate http://data.bls.gov/timeseries/LNS14000000
# U-6 unemployment rate http://data.bls.gov/timeseries/LNS13327709
# Part-Time Workers who want Full-Time Jobs (Table A-8's Part-Time For Economic Reasons) http://data.bls.gov/timeseries/LNS12032194
# Part-Time Workers (Table A-9) http://data.bls.gov/timeseries/LNS12600000
# Full-Time Workers (Table A-9) http://data.bls.gov/timeseries/LNS12500000
########################################################################
FFI on the most recent jobs report, straight from the Bureau of Labor Statistics: http://www.bls.gov/news.release/empsit.nr0.htm
Table A-1. Employment status of the civilian population by sex and age (household survey) http://www.bls.gov/news.release/empsit.t01.htm
Several graphs of the key economic stats -- http://www.bls.gov/web/empsit/cps_charts.pdf
The whole enchilada -- including all 16 "A" tables (the household survey) and all 9 "B" tables (the establishment survey) http://www.bls.gov/news.release/pdf/empsit.pdf
[font color = brown] ----------------------------------------------------------------------
Table A-1 and other tables can be found at the all-tables full jobs report at http://www.bls.gov/news.release/pdf/empsit.pdf, or gotten one-at-a-time from the bottom section of http://www.bls.gov/news.release/empsit.nr0.htm . For example, Table A-9 alone is at http://www.bls.gov/news.release/empsit.t09.htm )
----------------------------------------------------------------------[/font]
BLS Commissioner's Statement on The Employment Situation http://www.bls.gov/news.release/jec.nr0.htm
The Council of Economic Advisors' Take on the Jobs Report
https://www.whitehouse.gov/blog/2015/08/07/employment-situation-july
(find this at http://www.whitehouse.gov/administration/eop/cea and look for the last "The Employment Situation in" post)
Bureau of Labor Statistics Commissioner's Corner: http://beta.bls.gov/labs/blogs/ Twitter Account: https://twitter.com/BLS_gov
mahatmakanejeeves
(57,427 posts)Aug 7, 2015
Business Cycles
By Nick Timiraos and Josh Zumbrun
[email protected]
@NickTimiraos
[email protected]
@JoshZumbrun
The U.S. economy added 215,000 jobs in July, continuing a steady expansion. Friday’s report from the Labor Department showed few changes from the prior month on a range of measures, including the unemployment rate, at 5.3%, and the labor-force participation rate.
The economy has added around 2.9 million jobs over the past 12 months. That’s down slightly from earlier this year, when the 12-month paced surpassed three million, but it is still well ahead of the 2.5 million jobs added for the year ended July 2014.
....
Meanwhile, the unemployed rate held steady at 5.3%. A broader gauge of underemployment, which includes workers who have part-time positions but say they would like full-time jobs, ticked down to 10.4%.

The share of Americans in the labor force—that is, those who are working or looking for work, has remained at the lowest level since 1977. The share of Americans with jobs has risen slightly in the past five years, but remains lower than before the recession.

The vast majority of jobs added since the recession officially ended in June 2009 have been full-time positions. More than 8 million more full-time jobs have been added.


Beacool
(30,247 posts)It seems that the economy is indeed getting better a little at a time. I'm so glad for everyone who needs a job.

mahatmakanejeeves
(57,427 posts)candelista
(1,986 posts)