progree
progree's JournalMore graphs: PCE 3 month and 1 month annualized, and similarly CPI and PPI. Regular and core
The inflation situation as of the release of the PCE on 7/26/24. Here is a summary table followed by the graphs.
I annualize them all to be easy to compare to each other, and to compare to the FED's 2% goal. I use the actual index values rather than the one-digit changes that are commonly reported in the media. Links to the data are with the graphs.
ALL the numbers are the seasonally adjusted ones
The "1 month" number is the change from April to May expressed as an annualized number.
The "3 month" number is the growth over the last 3 months (and then annualized). It is calculated based on the change in the index number between the latest one and the one 3 months previous. e.g. if the latest index value is 304 and the one 3 months previous is 300, then the 3 month increase is 1.333333%
. . . (304/300 = 1.01333333 => [subtract 1 and multiply by 100%] => 1.333333%)
Annualized, it is 5.4%
. . . (1.01333333^4 = 1.0544095 => [subtract 1 and multiply by 100%] => 5.44095% => 5.4%).
. . . Most people just multiply the 3 month increase by 4 to annualize it: 1.333333%*4 = 5.333333% => 5.3% which isn''t technically correct (it leaves out compounding) but it is close for small percentage changes.
"Regular" is the "headline" number that has "everything"
"Core" is the regular with food and energy removed (The Fed prefers this as a basis for projecting FUTURE inflation)
Finally, the main summary table
All are seasonally adjusted and ANNUALIZED
PCE-Personal Consumption Expenditures Price Index (Fed's favorite inflation measure)
CPI-Consumer Price Index (retail)
PPI-Producer Price Index (Wholesale prices)
Links to the data are with the graphs below

Average real (i.e. inflation-adjusted) hourly earnings are up over the past 2 years and are above the pre-pandemic level:
. . . # Real average hourly earnings of production and non-supervisory workers: https://data.bls.gov/timeseries/CES0500000032
. . . # Real average hourly earnings of private sector workers: https://data.bls.gov/timeseries/CES0500000013
And now the graphs, in the following order:
* Core PCE and Regular PCE (Core PCE is the Fed's favorite for projecting FUTURE inflation)
* Core CPI and Regular CPI
* Wholesale inflation - Core PPI and Regular PPI (so to see the 7/12 update, page down to the last graphs)
CORE PCE through JUNE that came out 7/26/24
CORE PCE (seasonally adjusted): https://fred.stlouisfed.org/series/PCEPILFE
BEA.gov News release: https://www.bea.gov/ and click on "Personal Income and Outlays" or "Personal Income"
This is the one that the Fed weighs most heavily. The Fed weigh the PCE more heavily than the CPI. And in both cases, they weigh the CORE measures higher than the regular headline measures for projecting FUTURE inflation
I usually don't include the 6-month rolling average, but I had it handy, and it is fascinating how it gives such a different picture than the rolling 3 month average. The big reason for the difference is the huge January month-over-month increase (6.2% annualized), which is in the 6 month window, but not in the 3 month window. When January drops out of the 6 month window next month, it should look a lot different (i.e. it will show a downturn barring a shocker in next month's report)

Regular PCE through JUNE that came out 7/26/24
Regular PCE (seasonally adjusted): https://fred.stlouisfed.org/series/PCEPI
BEA.gov News release: https://www.bea.gov/ and click on "Personal Income and Outlays" or "Personal Income"

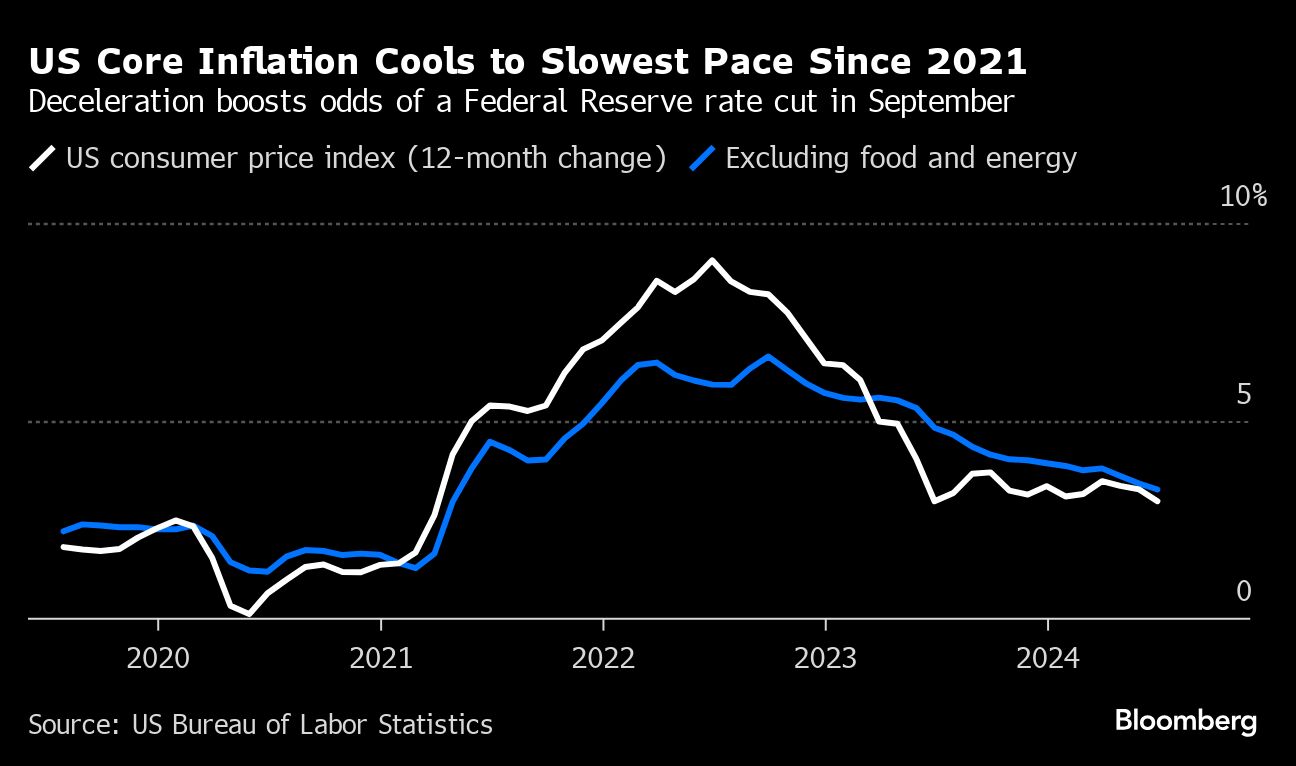
CORE CPI through June that came out 7/11/24
CORE CPI (seasonally adjusted) http://data.bls.gov/timeseries/CUSR0000SA0L1E
BLS CPI news release: https://www.bls.gov/news.release/cpi.nr0.htm

The Regular aka Headline CPI through June that came out 7/11/24
Regular CPI (seasonally adjusted) https://data.bls.gov/timeseries/CUSR0000SA0
BLS CPI news release: https://www.bls.gov/news.release/cpi.nr0.htm

Some Additional CPI Series of Interest
Shelter, which is pretty much all rent -- either regular rent or "owners' equivalent rent", has been a problematic issue -- because changes in new rents take several months before they appreciably move the CPI (because of the inertia of 11 months of older rents). It is the largest component of the Core CPI and one of the largest of the regular CPI. Through May, shelter remained elevated at 0.4% month over month for several months. Fortunately, in June it fell to a 0.2% increase. Year-over-year, shelter is up 5.1%
Shelter: https://data.bls.gov/timeseries/CUSR0000SAH1
Core Inflation less Shelter: https://data.bls.gov/timeseries/CUSR0000SA0L12E
^--This is up 0.0% for a 2nd month in a row, and a 3 month annualized average of +0.8% (compare to core of +2.1%)
Click on "More Formatting Options" on the upper right hand of screen, and on the page that appears, choose some or all of: "1-Month Percent Change", "3-Month Percent Change" and "12-Month Percent Change".
Headline CPI and Fed Rate Action

November 2019 - June 2024
The first tentative little quarter point rate increase was March 17, 2022, 12 months after year-over-year inflation went north of 2% in March 2021, and had reached 8.5%.
I'm fond of the 3 month averages as they are an average of 3 data points (so can't be easily dismissed as a "one off", unlike a single month-over-month figure), and they have much more recency than 12 month averages (yoy). I think of them as kinda a smoothed version of month-to-month.
FedFunds Target Rate (I used the upper end of the 0.25% width bracket): https://www.federalreserve.gov/monetarypolicy/openmarket.htm
WHOLESALE INFLATION (PPI - the Producer Price Index)
https://www.bls.gov/news.release/ppi.nr0.htm
As for which core PPI measure, since the BLS highlights the one below in its reporting (as opposed to the one without food and energy), then I guess I should do likewise.
CORE PPI (excluding food, energy, trade services) through June that came out 7/12/24:
CORE PPI (seasonally adjusted) http://data.bls.gov/timeseries/WPSFD49116

===========================================================
Regular PPI through June that came out 7/12/24 ( includes "everything" ):
Regular PPI (seasonally adjusted) http://data.bls.gov/timeseries/WPSFD4

It's strictly a Medicare SUPPLEMENT (Medigap) thing. The 6-month Medigap open enrollment period is once in a lifetime
Here's what it said when I said I am turning 65 --
https://www.medicare.gov/supplements-other-insurance/when-can-i-buy-medigap
https://www.medicare.gov/health-drug-plans/medigap/ready-to-buy
Your Medigap Open Enrollment Period
Under federal law, you get a 6 month Medigap Open Enrollment Period. It starts the first month you have Medicare Part B and you’re 65 or older. During this time, you:
* Can enroll in any Medigap policy.
* Will generally get better prices and more choices among policies.
* You can buy any Medigap policy sold in your state. An insurance company can’t use medical underwriting to decide whether to accept your application - they can’t deny you coverage due to pre-existing health problems.
* Can avoid or shorten waiting periods for a pre-existing condition if you buy a Medigap policy to replace creditable coverage. How do I know if I have creditable coverage?
After this period, you may not be able to buy a Medigap policy, or it may cost more. Your Medigap Open Enrollment Period is a one-time enrollment period. It doesn’t repeat every year, like the Medicare Open Enrollment Period.
Generally, your Medigap policy will begin the first of the month after you apply, but you can decide when you want it to start.
Graphic explaining how the Medigap Open Enrollment period works, including when it starts, how long it lasts, and when it ends.
View this image in Spanish.
What if I miss my Medigap Open Enrollment Period?
Outside of your Medigap Open Enrollment Period:
* You may have to pay more for a policy.
* Fewer policy options may be available to you.
* The insurance company is allowed to deny you a policy if you don’t meet their medical underwriting requirements.
There are certain situations where you may be able to buy a Medigap policy outside of your Medigap Open Enrollment Period. Situations where an insurance company can’t deny you a Medigap policy are called “guaranteed issue rights” or “Medigap protections.” What are guaranteed issue rights? ((this is a popup with numerous situations. For example one has a right to try Medicare Advantage for up to 12 months -Progree))
Check with your State Insurance Department to see if you can buy a Medigap policy outside of your Medigap Open Enrollment Period. You may have additional rights under state law.
All emphasis mine.
This is extremely very important information for people to know. People need to understand that they really really need to understand Medicare when they sign up (and when to sign up) and not wing it, thinking well I'll just sign up for something like a cheap or no premium Medicare Advantage plan, or riverboat gamble by just getting original Medicare (i.e. parts A and B with no supplement) and then learn more about it when I have time. Nope.
I have more on other issues with Medicare Supplement (Medigap) plans
https://www.democraticunderground.com/?com=view_post&forum=1142&pid=20175
People are amazed that Medicare is this tricky, treacherous, and complicated. But that's what happens when legislation is made the same way that sausage is made. To be clear, I love Medicare, but it's not the nearly free seamless program that many imagine it to be. I'm paying $505 / month combined in premiums for Part B, the Supplement, and a Part D drug plan combined, so it certainly isn't low cost.
Why your air conditioning bill is about to soar - the energy required rises with the SQUARE of the temperature differenc
Why your air conditioning bill is about to soar , Washington Post, 7/12/24
(no paywall on this MSN-hosted article)
https://www.msn.com/en-us/weather/topstories/why-your-air-conditioning-bill-is-about-to-soar/ar-BB1pRxnN
(summarizing, in my words) Air conditioning costs rise with the SQUARE of the difference between the indoor and outdoor temperatures. e.g. if the indoor setpoint is 75 degrees, then an increase in outdoor temperature of just 4 degrees, from 96 to 100, increases AC cost 42% !. Just for the heat pump aspect of it. Other factors increase that further.
The math: the difference between 75 degrees and 96 degrees is 21 degrees.
The difference between 75 degrees and 100 degrees is 25 degrees
(25/21)^2 = 1.417 => 41.7% increase
Plus more than half the greenhouse gas consequences (and presumably more than half of the electricity cost) comes from dehumidying, which older AC's don't do efficiently. As if that's bad enough, the inability of older AC's to reduce the humidity enough causes people to lower their thermostats to feel comfortable -- yet even more expense and more greenhouse gas emissions.
(No indication of what an "older" A/C is, but mine is about 1968, yes 56 years old, so I know I qualify. But I live in Minneapolis, so I didn't run it at all last year, and so far haven't come close to feeling the need this year -- a fan works just fine. But just about every time I step outside I hear the neighbors' AC's blasting away).
The refrigerants used in AC's also contribute to global warming (they don't quantify)
Couple this with:
How a small rightward shift in the average daily high temperature produces a huge increase in the frequency of very hot days:
e.g. a 2% increase in the July average daily high in a locale with a July average daily high of 85 degrees (e.g. New York City) produces a 2.44 fold increase (144% increase) in the number of 103+ degree July days.
https://www.democraticunderground.com/10143266574#post1
Combine the 2 factors above, and one will find a massive increase in electricity bills (and ghg emissions) for a small shift in average temperature. I'm thinking about how to calculate the combined effect.
More on increased frequency of heat waves:
Heat Waves - decade by decade from the 1960's on - 4 bar charts: Heat Wave Frequency, Heat Wave Duration, ...
https://www.democraticunderground.com/1127174794
All 3 inflation graphs (latest: PPI wholesale prices, 7/12/24)
As always, I've been seeing some mischaracterizations of the recent inflation situation in the media, so here is a summary table followed by the graphs.
I annualize them all to be easy to compare to each other, and to compare to the FED's 2% goal. I use the actual index values rather than the one-digit changes that are commonly reported in the media. Links to the data are with the graphs.
ALL the numbers are the seasonally adjusted ones
The "1 month" number is the change from April to May expressed as an annualized number.
The "3 month" number is the growth over the last 3 months (and then annualized). It is calculated based on the change in the index number between the latest one and the one 3 months previous. e.g. if the latest index value is 304 and the one 3 months previous is 300, then the 3 month increase is 1.333333%
. . . (304/300 = 1.01333333 => [subtract 1 and multiply by 100%] => 1.333333%)
Annualized, it is 5.4%
. . . (1.01333333^4 = 1.0544095 => [subtract 1 and multiply by 100%] => 5.44095% => 5.4%).
. . . Most people just multiply the 3 month increase by 4 to annualize it: 1.333333%*4 = 5.333333% => 5.3% which isn''t technically correct (it leaves out compounding) but it is close for small percentage changes.
"Regular" is the "headline" number that has "everything"
"Core" is the regular with food and energy removed (The Fed prefers this as a basis for projecting FUTURE inflation)
Finally, the main summary table
All are seasonally adjusted and ANNUALIZED
PCE-Personal Consumption Expenditures Price Index (Fed's favorite inflation measure)
CPI-Consumer Price Index (retail)
PPI-Producer Price Index (Wholesale prices)
Links to the data are with the graphs below

Average real (i.e. inflation-adjusted) hourly earnings are up over the past 2 years and are above the pre-pandemic level:
. . . # Real average hourly earnings of production and non-supervisory workers: https://data.bls.gov/timeseries/CES0500000032
. . . # Real average hourly earnings of private sector workers: https://data.bls.gov/timeseries/CES0500000013
And now the graphs, in the following order:
* Core CPI and Regular CPI
* Core PCE and Regular PCE (Core PCE is the Fed's favorite for projecting FUTURE inflation)
* Wholesale inflation - Core PPI and Regular PPI (so to see the 7/12 update, page down to the last graphs)
CORE CPI through June that came out 7/11/24
CORE CPI (seasonally adjusted) http://data.bls.gov/timeseries/CUSR0000SA0L1E
BLS CPI news release: https://www.bls.gov/news.release/cpi.nr0.htm
The Regular aka Headline CPI through June that came out 7/11/24
Regular CPI (seasonally adjusted) https://data.bls.gov/timeseries/CUSR0000SA0
BLS CPI news release: https://www.bls.gov/news.release/cpi.nr0.htm
Some Additional CPI Series of Interest
Shelter, which is pretty much all rent -- either regular rent or "owners' equivalent rent", has been a problematic issue -- because changes in new rents take several months before they appreciably move the CPI (because of the inertia of 11 months of older rents). It is the largest component of the Core CPI and one of the largest of the regular CPI. Through May, shelter remained elevated at 0.4% month over month for several months. Fortunately, in June it fell to a 0.2% increase. Year-over-year, shelter is up 5.1%
Shelter: https://data.bls.gov/timeseries/CUSR0000SAH1
Core Inflation less Shelter: https://data.bls.gov/timeseries/CUSR0000SA0L12E
^--This is up 0.0% for a 2nd month in a row, and a 3 month annualized average of +0.8% (compare to core of +2.1%)
Click on "More Formatting Options" on the upper right hand of screen, and on the page that appears, choose some or all of: "1-Month Percent Change", "3-Month Percent Change" and "12-Month Percent Change".
Headline CPI and Fed Rate Action
November 2019 - June 2024
The first tentative little quarter point rate increase was March 17, 2022, 12 months after year-over-year inflation went north of 2% in March 2021, and had reached 8.5%.
I'm fond of the 3 month averages as they are an average of 3 data points (so can't be easily dismissed as a "one off", unlike a single month-over-month figure), and they have much more recency than 12 month averages (yoy). I think of them as kinda a smoothed version of month-to-month.
FedFunds Target Rate (I used the upper end of the 0.25% width bracket): https://www.federalreserve.gov/monetarypolicy/openmarket.htm
CORE PCE through MAY that came out 6/28/24
CORE PCE (seasonally adjusted): https://fred.stlouisfed.org/series/PCEPILFE
BEA.gov News release: https://www.bea.gov/ and click on "Personal Income and Outlays" or "Personal Income"
This is the one that the Fed weighs most heavily. The Fed weigh the PCE more heavily than the CPI. And in both cases, they weigh the CORE measures higher than the regular headline measures for projecting FUTURE inflation

Regular PCE through MAY that came out 6/28/24
Regular PCE (seasonally adjusted): https://fred.stlouisfed.org/series/PCEPI
BEA.gov News release: https://www.bea.gov/ and click on "Personal Income and Outlays" or "Personal Income"

WHOLESALE INFLATION (PPI - the Producer Price Index)
https://www.bls.gov/news.release/ppi.nr0.htm
As for which core PPI measure, since the BLS highlights the one below in its reporting (as opposed to the one without food and energy), then I guess I should do likewise.
CORE PPI (excluding food, energy, trade services) through June that came out 7/12/24:
CORE PPI (seasonally adjusted) http://data.bls.gov/timeseries/WPSFD49116
===========================================================
Regular PPI through June that came out 7/12/24 ( includes "everything" ):
Regular PPI (seasonally adjusted) http://data.bls.gov/timeseries/WPSFD4
CPI Year Over Year vs. Fed Funds Target Rate Graph

Blue: CPI, Red: Fed Funds Target Rate
November 2019 - June 2024
It used to be that most here were blaming the Fed for stupidly believing that inflation was transient and taking way too long to raise rates to bring it down. Kinda looks that way. The first tentative little quarter point rate increase was March 17, 2022, 14 months after year-over-year inflation went north of 2%, and had reached 8.5%.
Except I don't know about "stupidly" - for a while some were saying that the excess inflation was natural and healthy make-up for nearly a year of well below 2% inflation. And that a large part of it was a natural response to the economy opening up and recovering after the pandemic shutdowns, plus supply chain issues. All very reasonable, but went well past their "best used by" date.
CPI: https://data.bls.gov/timeseries/CUSR0000SA0
FedFunds Target Rate (I used the upper end of the 0.25% width bracket): https://www.federalreserve.gov/monetarypolicy/openmarket.htm
Here's the same graph, but I added the rolling 3 month average CPI (thin blue line) to it:
November 2019 - June 2024
I'm fond of the 3 month averages as they are an average of 3 data points (so can't be easily dismissed as a "one off", unlike a single month-over-month figure), and they have much more recency than 12 month averages (yoy). I think of them as kinda a smoothed version of month-to-month.
CPI vs. Core CPI since 2019:
GRAPHS AND LINKS - Regular and Core for all 3 inflation measures: CPI, PCE, PPI
As always, I've been seeing some mischaracterizations of the recent inflation situation in the media, so here is a summary table followed by the graphs.
I annualize them all to be easy to compare to each other, and to compare to the FED's 2% goal. I use the actual index values rather than the one-digit changes that are commonly reported in the media. Links to the data are with the graphs.
ALL the numbers are the seasonally adjusted ones
The "1 month" number is the change from April to May expressed as an annualized number.
The "3 month" number is the growth over the last 3 months (and then annualized). It is calculated based on the change in the index number between the latest one and the one 3 months previous. e.g. if the latest index value is 304 and the one 3 months previous is 300, then the 3 month increase is 1.333333%
. . . (304/300 = 1.01333333 => [subtract 1 and multiply by 100%] => 1.333333%)
Annualized, it is 5.4%
. . . (1.01333333^4 = 1.0544095 => [subtract 1 and multiply by 100%] => 5.44095% => 5.4%).
. . . Most people just multiply the 3 month increase by 4 to annualize it: 1.333333%*4 = 5.333333% => 5.3% which isn''t technically correct (it leaves out compounding) but it is close for small percentage changes.
"Regular" is the "headline" number that has "everything"
"Core" is the regular with food and energy removed (The Fed prefers this as a basis for projecting FUTURE inflation)
Finally, the main summary table
All are seasonally adjusted and ANNUALIZED
PCE-Personal Consumption Expenditures Price Index (Fed's favorite inflation measure)
CPI-Consumer Price Index (retail)
PPI-Producer Price Index (Wholesale prices)
Links to the data are with the graphs below

***NOTE: The new PPI (wholesale inflation) comes out tomorrow, 7/12/24 *******
Average real (i.e. inflation-adjusted) hourly earnings are up over the past 2 years and are above the pre-pandemic level:
. . . # Real average hourly earnings of production and non-supervisory workers: https://data.bls.gov/timeseries/CES0500000032
. . . # Real average hourly earnings of private sector workers: https://data.bls.gov/timeseries/CES0500000013
And now the graphs, in the following order:
* Core CPI and Regular CPI
* Core PCE and Regular PCE (Core PCE is the Fed's favorite for projecting FUTURE inflation)
* Wholesale inflation - Core PPI and Regular PPI
CORE CPI through June that came out 7/11/24
CORE CPI (seasonally adjusted) http://data.bls.gov/timeseries/CUSR0000SA0L1E
BLS CPI news release: https://www.bls.gov/news.release/cpi.nr0.htm
The Regular aka Headline CPI through June that came out 7/11/24
Regular CPI (seasonally adjusted) https://data.bls.gov/timeseries/CUSR0000SA0
BLS CPI news release: https://www.bls.gov/news.release/cpi.nr0.htm
Some Additional CPI Series of Interest
Shelter, which is pretty much all rent -- either regular rent or "owners' equivalent rent", has been a problematic issue -- because changes in new rents take several months before they appreciably move the CPI (because of the inertia of 11 months of older rents). It is the largest component of the Core CPI and one of the largest of the regular CPI. Through May, shelter remained elevated at 0.4% month over month for several months. Fortunately, in June it fell to a 0.2% increase. Year-over-year, shelter is up 5.1%
Shelter: https://data.bls.gov/timeseries/CUSR0000SAH1
Core Inflation less Shelter: https://data.bls.gov/timeseries/CUSR0000SA0L12E
^--This is up 0.0% for a 2nd month in a row, and a 3 month annualized average of +0.8% (compare to core of +2.1%)
Click on "More Formatting Options" on the upper right hand of screen, and on the page that appears, choose some or all of: "1-Month Percent Change", "3-Month Percent Change" and "12-Month Percent Change".
CORE PCE through MAY that came out 6/28/24
CORE PCE (seasonally adjusted): https://fred.stlouisfed.org/series/PCEPILFE
BEA.gov News release: https://www.bea.gov/ and click on "Personal Income and Outlays" or "Personal Income"
This is the one that the Fed weighs most heavily. The Fed weigh the PCE more heavily than the CPI. And in both cases, they weigh the CORE measures higher than the regular headline measures for projecting FUTURE inflation
Regular PCE through MAY that came out 6/28/24
Regular PCE (seasonally adjusted): https://fred.stlouisfed.org/series/PCEPI
BEA.gov News release: https://www.bea.gov/ and click on "Personal Income and Outlays" or "Personal Income"
WHOLESALE INFLATION (PPI - the Producer Price Index)
https://www.bls.gov/news.release/ppi.nr0.htm
As for which core PPI measure, since the BLS highlights the one below in its reporting (as opposed to the one without food and energy), then I guess I should do likewise.
CORE PPI (excluding food, energy, trade services) through May that came out 6/13/24:
CORE PPI (seasonally adjusted) http://data.bls.gov/timeseries/WPSFD49116

===========================================================
Regular PPI through May that came out 6/13/24 ( includes "everything" ):
Regular PPI (seasonally adjusted) http://data.bls.gov/timeseries/WPSFD4

***NOTE: The new PPI (wholesale inflation) comes out tomorrow, 7/12/24 *******
It was a combination of several factors that resulted in GW Bush's win. ALL were essential to producing that outcome
The following is from https://democraticunderground.com/100216793000#post32
which has several more posts from people trying unsuccessfully to argue that Nader's candidacy didn't affect the outcome (besides #32, #34, #35, #57, #73)
First, note that officially, Bush beat Gore by 537 votes in Florida. Nader got 97,488 votes in Florida. {1}
I have heard and read Nader make the dubious claim:
"In the year 2000, exit polls reported that 25% of my voters would have voted for Bush, 38% would have voted for Gore and the rest would not have voted at all." {2}
Well, that still means a net of 13%, or 12,665, more votes would have gone to Gore than to Bush {2}. That's overwhelming more than the 537 vote Bush victory margin.
This one has 21% would have voted for Bush, and 47% would have voted for Gore, for a 26% gap, or 25,347 more votes for Gore than Bush {3}
{1} http://www.infoplease.com/ipa/A0876793.html
{2} http://en.wikipedia.org/wiki/Ralph_Nader_presidential_campaign,_2000
{3} http://www.huffingtonpost.com/eric-zuesse/ralph-nader-was-indispens_b_4235065.html
` http://www.cbsnews.com/news/nader-to-crash-dems-party/
Yes, yes, I know there were a number of reasons Bush officially beat Gore -- ALL of them were essential to Bush's victory -- IF EVEN ONE of these elements had been missing, Bush would have officially lost,
e.g. besides Nader’s candidacy, Kathleen Harris purging the voting lists of supposed felons, Gore running a poor campaign (in so so many ways), media dubbing Gore a serial liar (Love Story and all that), the butterfly ballots giving Gore's votes to Buchanan, the U.S. Supreme Court stopping the recount -- yada.
But it doesn't wipe out the fact that even with all that, Gore would have won if not for Nader drawing thousands more votes away from Gore than from Bush.
As for the Supreme Court -- if the vote count on election night and the days and weeks after the election had put Gore ahead by 12,000 or 25,000 votes instead of down by 500 or 600, it would unlikely have gone to the Supreme Court; and even less likely that they would have declared the 12,000 or 25,000 vote count loser to be the winner of Florida's electoral votes.
And Nader broke his pledge (made when getting petition signatures to get on the ballot in several states) to not campaign in swing states, and instead did his utmost to defeat Gore. And yet Michael Moore supported him all the way.
And Nader trashing the Democrats as being as bad as the Republicans no doubt also affected some voters to not vote for a president or to stay home - things not captured in the election statistics.
It was a combination. I don't doubt that there were many factors larger than Nader being on the ballot that caused the official Bush win and Gore loss, including, many times over, the voter purges. But had any element mentioned in the above post been absent, Gore would have been inaugurated.
A small little change in average temperatures dramatically increases the number of days with extreme temperatures

The graph illustrates that a small shift to the right in the average shifts the whole bell curve to the right, and, in this illustration makes hot weather (orange) much more common and extreme hot weather (red) from almost zero probability to considerable probability
if, for example, the average daily high in July in some locale is 85 degrees with a 6 degree standard deviation, and normally distributed: [1]
then the number of days when the high is 103 or above (3 standard deviations above the mean) is 0.1350% of July days.
In Excel, the formula for finding the area under the normal distribution from 103 to infinity with an average of 85 and standard deviation of 6 is:
=1-NORM.DIST(103,85,6,TRUE)
which gives an answer of 0.001350 which is 0.1350% [2]
OK, so no biggie. So what?
Now lets say that due to climate change so far, the average July daily high temperature has shifted by just 2% to the right, from 85 to 86.7
then the number of days when the high is 103 or above changes to 0.3297% of July days.
That's a 2.44 fold increase (144% increase) in the number of 103+ degree days for just a 2% increase in the average.
Shift the average 4% to the right, from 85 to 88.434, and you get 0.7598% of July days, a 5.63 fold increase (463% increase) in the number of 103+ degree days.
=====================================
Repeating the above exercise, but with a less extreme example, finding the number of days with a high of 97 or above (2 standard deviations above the mean)
with an average July daily high of 85 degrees, the number of July days when the high is 97 degrees or above is 2.275% of July days.
Now lets say that due to climate change so far, the average July daily high temperature has shifted by just 2% to the right, from 85 to 86.7 degrees
then the number of July days when the high is 97 or above changes to 4.302% of July days.
That's a 1.89 fold increase (89% increase) in the number of 97+ degree days for just a 2% increase in the average.
Shift the average 4% to the right, from 85 to 88.434, and you get 7.669% of July days, a 3.37 fold increase (237% increase) in the number of 97+ degree days.
=====================================
The same principle applies to other climate change events, e.g. the severity of storms or what have you -- a small shift in the average results in a huge increase in the number of extreme events.
======= FOOTNOTES ===========
[1] Temperatures are normally distributed according to a Google search.
Picking New York City for example (with an 84 degree average daily high in July)
https://weatherspark.com/m/23912/7/Average-Weather-in-July-in-New-York-City-New-York-United-States
The 10 and 90 percentile bands are shown on the graph, and they are (reading from the graph and using the peak July date) are 77 to 92, which is a band width of 15.
That occurs when X is -1.281552 to +1.281552 standard deviations
https://en.wikipedia.org/wiki/Standard_deviation
See the big table about 2/3 of the way down the article that has this row:
1.281552sigma 80% 20%
Meaning that between minus and plus 1.281552sigma, 80% are within that confidence interval and 20% are outside of it.
(The greek symbol sigma is the symbol for standard deviation. DU replaces it with a "?" so I show "sigma" in the above)
So for a 10 to 90 bandwidth of 15, the standard deviation is 5.85228
(15/2 = 7.5, 7.5/1.281552 = 5.85228)
So, rounding, I used 6 as my standard deviation in the above example.
[2] The TRUE means its the cumulative normal distribution as opposed to the probability density function
The area under the normal distribution curve from minus infinity to 103 (and having an average of 85 and standard deviation of 6) is NORM.DIST(103,85,6,TRUE)
The area from 103 to infinity is
1-NORM.DIST(103,85,6,TRUE)
SIM card hell - New SIM card required by Consumer Cellular, but it reduced battery life down by 2/3
They are increasing the pressure on me to install the new SIM card by increasing the legacy network charge from $5 to $10/month if I don't...
My phone is a Galaxy S10e (Android), purchased new in late 2019.
Last August, Consumer Cellular (CC) said my SIM card was obsolete and I promptly ordered a new one. But I couldn't figure out how to install it (and yes I've put in SIM cards before in other phones without problems).
To make the long story short, I finally, after searching for videos, found a way to install it - see [1] below. But my phone app and text messaging did not work at all, and the battery life was cut short from 3 to 4 days to 1.3 days if not used at all, to something much less if I used it (for web browsing or listening to TuneIn -- like for my typical trip away from home for a few hours it wouldn't have held up even if fully charged at the start). Yes, I have a battery pack but using it would require considerable recharge time and maybe 2 recharges - not practical.
I called CC again and we didn't come up with a solution. So I replaced the new SIM card with the old one and everything was fine, including the battery life which was back to the 3-4 days.
But they've been bombarding me with texts, emails, and phone calls for months about how they were going to charge me a $5/month legacy network surcharge until I replaced my SIM, and that eventually my phone might stop working. (I've been paying the extra $5/month for about 3 months so far). Today they said they would start charging $10/month extra.
One thing when I had the new SIM card in for awhile -- I think the problem on the phone app and text message app not working is that I may NOT have successfully activated it after installation (my notes are confusing about that). But to check this out and try again, I hesitate to try again because I fear once I successfully activate it, I will end up with the too-short battery life, and I won't be able to go back to the old SIM card. So I've just swallowed the $5/month surcharge and kept the old card in. But an extra $10/month is starting to get pricey, and they may just keep increasing it, and like they say, the phone eventually might not work at all.
FINALLY, THE QUESTION: Has anyone had similar difficulties with new SIM cards causing a huge reduction in battery life? Am I right to think that if I install and activate the new SIM card, there's likely no way in hell of being able to use the old SIM card again?
Thanks much in advance
=====================================================
[1] (Not essential details, no need to read) The instructions sent with the SIM card were horrible and a couple of calls to Consumer Cellular were not helpful. And I broke the little key thing that one pokes in the hole, and they wouldn't send me a new one. Though she said a partly straightened out paper clip would work. I finally found a video that was just exactly like my phone that showed exactly where to poke (the CC written instructions didn't even have that info), but I bent to uselessness a couple of paperclips. Still no dice.
I finally found a video about dealing with phones whose SIM card drawer didn't pop out (partially) like it should when the hole is poked: Use a LOT of pressure to poke as some old phones' SIM drawers sometimes get stuck. But I had already used enough pressure to bend a couple of paperclips. And other instructions I had encountered warned against applying too much pressure.
But anyhow, I unbent another paperclip, held the last 3/8-1/4" or so of it with my needle-nose pliars, under the theory that only the most extreme force would cause 1/4" of paperclip to bend. It worked -- I was able to push it in the hole with enough force to pop open the SIM tray.
I put the new SIM card in (instructions were horrible and it was some kind of thingy where actually it was 3 SIM cards in one, and one had to figure out which one, and its orientation, is the right fit for the phone. It was the smallest tiniest chip of the three. And the online instructions to activate it went all over the place link after link after link, and eventually I think I activated it, but am not at all sure. As I say in the above, the new SIM card didn't work.
Graphs, CPI, PPI, and today's PCE, Regular and Core
As always, I've been seeing some mischaracterizations of the recent inflation situation in the media, so here is a summary table followed by the graphs.
I annualize them all to be easy to compare to each other, and to compare to the FED's 2% goal. I use the actual index values rather than the one-digit changes that are commonly reported in the media. Links to the data are with the graphs.
ALL the numbers are the seasonally adjusted ones
The "1 month" number is the change from April to May expressed as an annualized number.
The "3 month" number is the growth over the last 3 months (and then annualized). It is calculated based on the change in the index number between the latest one and the one 3 months previous. e.g. if the latest index value is 304 and the one 3 months previous is 300, then the 3 month increase is 1.333333%
. . . (304/300 = 1.01333333 => [subtract 1 and multiply by 100%] => 1.333333%)
Annualized, it is 5.4%
. . . (1.01333333^4 = 1.0544095 => [subtract 1 and multiply by 100%] => 5.44095% => 5.4%).
. . . Most people just multiply the 3 month increase by 4 to annualize it: 1.333333%*4 = 5.333333% => 5.3% which isn''t technically correct (it leaves out compounding) but it is close for small percentage changes.
"Regular" is the "headline" number that has "everything"
"Core" is the regular with food and energy removed (The Fed prefers this as a basis for projecting FUTURE inflation)
Finally, the main summary table
All are seasonally adjusted and ANNUALIZED
PCE-Personal Consumption Expenditures Price Index (Fed's favorite inflation measure)
CPI-Consumer Price Index (retail)
PPI-Producer Price Index (Wholesale prices)
Links to the data are with the graphs below

Average real (i.e. inflation-adjusted) hourly earnings are up over the past 2 years and are above the pre-pandemic level:
. . . # Real average hourly earnings of production and non-supervisory workers: https://data.bls.gov/timeseries/CES0500000032
. . . # Real average hourly earnings of private sector workers: https://data.bls.gov/timeseries/CES0500000013
And now the graphs, in the following order:
* Core PCE and Regular PCE (Core PCE is the Fed's favorite for projecting FUTURE inflation)
* Core CPI and Regular CPI
* Wholesale inflation - Core PPI and Regular PPI
CORE PCE through MAY that came out 6/28/24
CORE PCE (seasonally adjusted): https://fred.stlouisfed.org/series/PCEPILFE
BEA.gov News release: https://www.bea.gov/ and click on "Personal Income and Outlays" or "Personal Income"
This is the one that the Fed weighs most heavily. The Fed weigh the PCE more heavily than the CPI. And in both cases, they weigh the CORE measures higher than the regular headline measures for projecting FUTURE inflation
Regular PCE through MAY that came out 6/28/24
Regular PCE (seasonally adjusted): https://fred.stlouisfed.org/series/PCEPI
BEA.gov News release: https://www.bea.gov/ and click on "Personal Income and Outlays" or "Personal Income"
CORE CPI through May that came out 6/12/24
CORE CPI (seasonally adjusted) http://data.bls.gov/timeseries/CUSR0000SA0L1E
BLS CPI news release: https://www.bls.gov/news.release/cpi.nr0.htm

The Regular aka Headline CPI through May that came out 6/12/24
Regular CPI (seasonally adjusted) https://data.bls.gov/timeseries/CUSR0000SA0
BLS CPI news release: https://www.bls.gov/news.release/cpi.nr0.htm

WHOLESALE INFLATION (PPI - the Producer Price Index)
https://www.bls.gov/news.release/ppi.nr0.htm
As for which core PPI measure, since the BLS highlights the one below in its reporting (as opposed to the one without food and energy), then I guess I should do likewise.
CORE PPI (excluding food, energy, trade services) through May that came out 6/13/24:
CORE PPI (seasonally adjusted) http://data.bls.gov/timeseries/WPSFD49116
===========================================================
Regular PPI through May that came out 6/13/24 ( includes "everything" ):
Regular PPI (seasonally adjusted) http://data.bls.gov/timeseries/WPSFD4
Profile Information
Gender: MaleHometown: Minnesota
Member since: Sat Jan 1, 2005, 04:45 AM
Number of posts: 11,204