NNadir
NNadir's JournalLittle Wing.
<iframe width="854" height="480" src="
" frameborder="0" allowfullscreen></iframe>Fields of Gold
Sung by the posthumously famous Eva Cassidy.
<iframe width="854" height="480" src="
Sting is an insufferable fool, but he writes a catchy, sometimes even a beautiful, tune.
CO2 readings at Mauna Loa briefly fall below 400 ppm for a few hours. Last time ever?
I monitor what's going on at the Mauna Loa observatory, and in this remarkable year, 2016, where carbon dioxide concentrations in the atmosphere are rising at the fastest rate ever recorded, I have been regularly posting here about the data, which I find even more terrifying than an idiot with orange hair running for President on an overtly racist platform. Compared to the risks of climate change, a prominent North American country going fascist is small potatoes, relatively at least.
My most recent remarks on this subject are here: All time record set for week-to-week annual measurements of annual CO2 increases at Mauna Loa.
The most recently available reported comparison between the data of a week this year in comparison to the same week of the previous year, showed that the concentration of carbon dioxide for week of July 10, 2016 was 2.81 ppm higher than the previous year. This is the first recorded piece of data since the week of March 6 that showed an increase in CO2 concentrations that was below 3.2 ppm when compared with the same week of the previous year. By itself, were 2.81 ppm higher than the previous year an annual reading as opposed to a reading from a single week, it would come in as the third worst year ever observed, after 2015 (3.05 ppm) and 1998, (2.93 ppm).
This graphic from the Mauna Loa Observatories website shows the annual data:

Carbon dioxide increases connected with the failure of humanity to take the issue seriously and think anew are climbing more or less linearly, albeit recently with a non-zero 2nd derivative. However a sinusoidal wave is superimposed on this function, as the following graphic (from the Mauna Loa CO2 Observatory's page), which should be familiar to anyone who checks this website, shows that to which I refer:

Here is a blow up from recent years:

Generally the maximum each year is reached in April or May, reflecting the concentration of landmasses in the Northern Hemisphere; the minimum is reached in late September or in early October.
In 2015, the worst year ever observed, a high reading of 404.11 ppm was reached; by September 27, it had fallen to a low of 397.2. Thus the magnitude of the swing was 6.91 ppm.
In 2016, the high was reached on April 10, at 408.69. If it falls by the same amount it will not fall below 400 ppm ever again.
However there is a certain amount of analytical noise in the readings, and something happened this week on July 18, as the weekly graphic shows, and briefly, for a few hours, values below 400 ppm were recorded, as low as 399 ppm.
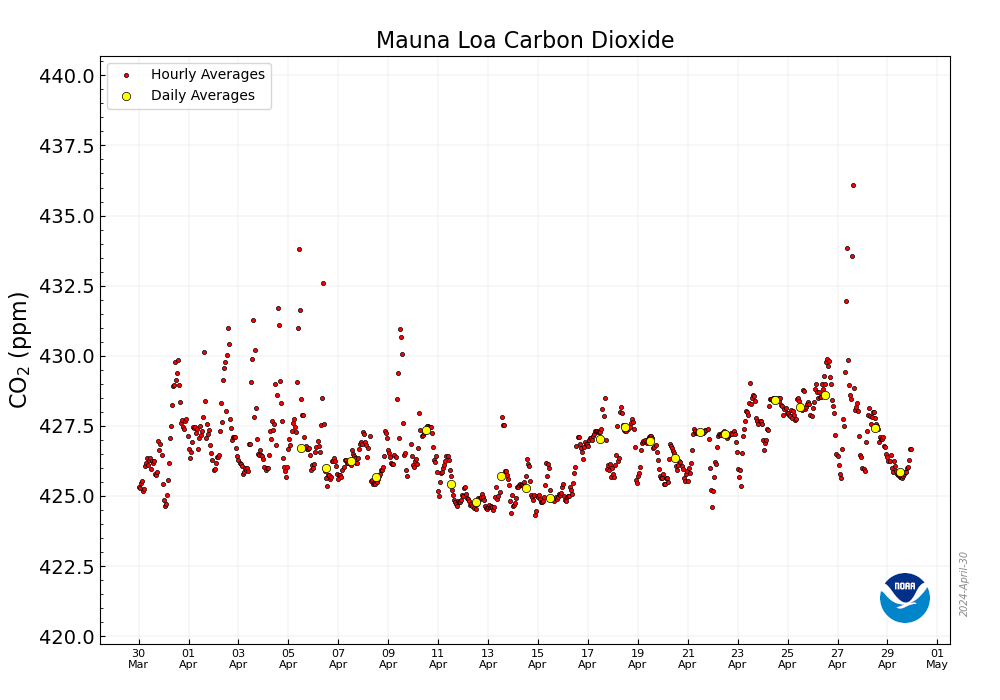
Enjoy it. It may be the last time anyone now living will see something below 400 ppm. It may be just an analytical artifact, but we can dream, can't we?
July 21 recorded 404.92 ppm.
If any of this depresses you, don't worry be happy. Researchers continue to work on so called "renewable energy"; and we have "breakthroughs" announced here every day, as we have for the last 12 years. They haven't worked; they aren't working and they won't work, but it's the thought that counts, not results.
Have a nice weekend.
Fragile.
<iframe width="854" height="480" src="
" frameborder="0" allowfullscreen></iframe>From February to June of 2016, each month has established new records for CO2 increases in that...
month.
The Mauna Loa Carbon Dioxide Observatory (accessed 07/08/16) reports each month the values for carbon dioxide concentrations of the previous month, comparing them with the same month of the previous year.
Previously in this space, I reported that April 2016 set a new record for any monthly increase in any month, 4.16 ppm higher than April of 2015, 2015 itself having been the worst year ever recorded for carbon dioxide increases.
April 2016 over April 2015 sets the all time monthly record for increases in atmospheric CO2.
That was the first value ever recorded to exceed 4.00 ppm for a month compared to the same month of the previous year.
June of 2016, the month just passed has now become the second such month, coming in at 4.01 ppm over June of 2015.
For perspective, consider this: This data goes back to 1959 when the observatory was opened. It took until 1973 to record the first month that had an increase in carbon dioxide greater than 2.00 ppm. March of 1973 was 2.55 ppm over March of 1972. August of 1973 narrowly missed being the first month to exceed 3.00, having come in at 2.99 ppm. However no month did exceed 3.00 ppm until June of 1998, when after the massive fires in Southeast Asia that began when fires set to clear rain forest for palm oil plantations designed to produce so called "renewable energy," biodiesel, went out of control, burning much of the Indonesian and Malaysian rain forests. Since January of 2015 only three of the eighteen months recorded have been below 2.00 ppm increases over the same month of previous year, seven of the eighteen have been over 3.00 ppm, and all seven have occurred since November of 2015.
February of 2016 was the worst February ever recorded, coming in at 3.76 ppm over February 2015. March of 2016 was the worst March ever recorded, coming in at 3.31 ppm over March of 2015. April of 2016 we've already discussed as the worst monthly increase ever observed. May of 2016 was the worst May ever recorded, coming in at 3.76 ppm, tying it with February for the 3rd worst month ever observed, and, again, June of 2016 is the worst June ever recorded, and the second worst month ever recorded.
Thus five of the six past months have each set a records for those months for being the worst of all time.
It is very clear from this data, and the weekly data which I similarly record and about which I've written this year extensively, most recently a few weeks back ( All time record set for week-to-week annual measurements of annual CO2 increases at Mauna Loa.) that all our efforts to address climate change are miserable failures.
If any of this upsets you, don't worry be happy. Reporters - obviously reporters who have never passed or taken a science or engineering course but who cares? - at Reuters have reported that Big solar is leaving rooftop systems in the dust. "Big Solar" after decades of cheering for it, and hundreds of billions of dollars sunk into it, is producing as much energy as three average sized coal plants in the United States, but it's the thought that counts, not the results.
I'm sure future generations, when considering ours, will happily overlook the fact that we completely and totally destroyed the atmosphere, this while dreaming of the wind and solar nirvana that, like Godot, never comes.
As a long time critic of our delusions of these types, if any of this sounds like Shadenfreud, it's not. The heat chokes the just and unjust alike.
Have a nice weekend.
Ain't nobody...
<iframe width="854" height="480" src="
" frameborder="0" allowfullscreen></iframe>The fastest growing source of US electricity has lead to large CO2 reductions for US electricity.
Recently it was my pleasure to attend a scientific lecture (on the subject of concrete and carbon dioxide emissions) in which reference to the famous Socolow and Pacala paper published in Science in 2004 was made. This is the paper that refers to the use of "stabilization wedges" to slow carbon dioxide emissions using technology which the authors claimed were already available at that time.
The full text of this paper from the primary scientific literature is readily available on the internet, and for convenience, here is a link to one of the many places you can read it:
Pacala and Socolow, Science 305, 968 (2004) The paper is entitled: "Stabilization Wedges: Solving the Climate Problem for the Next 50 Years with Current Technologies."
We are now 12 years into the "Next 50 Years" that the authors included in the title of their paper.
Have we stabilized the climate, or made significant progress toward doing so?
Before I turn to giving my answer to this question, let me start off by giving us some good news:
In the last ten years, the United States has significantly reduced the amount of carbon dioxide it releases to generate electricity. The reduction has been impressive. Using the process I will briefly outline below, I estimate that the reduction in US electricity carbon dioxide releases to generate electricity has amounts to 431 million tons of carbon dioxide per year from 2005 to 2015. Moreover the chief means by which it did so is indeed by employing one of the Pacala and Socolow "existing technology" "stabilization wedges."
"Which one?" you may ask.
If one opens the paper linked above, in table 1 one may see a list of the "existing technologies" that would save the day. One may peruse the list to see the list of possible "wedges" advertised as a "current technology" (in 2004) in order to review the candidates that helped the US to reduce its carbon dioxide emissions for electricity in the last ten years.
I will work from the data published at the US Energy Information Agency's website to examine this point. The data may be found at the Electricity Data Browser page at that website. I used the "Download" button in the upper right hand corner, selected the *.CSV table format, which I loaded into Excel for convenience in calculation.
In order to explore the point of from whence the carbon dioxide reductions came, I utilized the figures found in a scientific paper written in 2005 by renewable energy advocate Paul Denholm, who was writing a paper on the subject of how wind energy could be stored for use as base load power in the form of highly compressed air. (The "compressed air energy storage system - "CAES" - would receive a boost by heating it using dangerous natural gas in a Brayton cycle system.) The reason I used a paper written by a "renewable energy will save us" advocate is because the reader who is familiar with my views will be aware that I am hostile to so called "renewable energy" which I contend will never be as safe, as sustainable, or as affordable as nuclear energy, nuclear energy being the form of energy for which I am a passionate advocate. Thus in using the data from an advocate of wind energy - which I oppose - I am trying to be "fair."
One may note that the number of utility scale CAES wind systems built in the last 11 years since Denholm's paper was published is zero, but nonetheless the paper has been cited 76 times according to Google Scholar. Speculation about the potential of so called "renewable energy" is always popular.
The paper is this one: Emissions and Energy Efficiency Assessment of Baseload Wind Energy Systems (Environ. Sci. Technol., 2005, 39 (6), pp 1903–1911)
If one is a subscriber for this useful journal or accesses it a a good scientific library, one can use the data in Table 2 on page 1909 to see the putative range of carbon dioxide emissions for four forms of electrical generation that I will discuss, dangerous coal, dangerous natural gas, wind (with no storage) and nuclear energy, since these four forms of energy have the most relevance. I have chosen the upper limit in all cases, and have ignored that many dangerous natural gas plants are not "combined cycle" plants which have higher efficiency than simple dangerous natural gas plants. (All combined cycle plants operate at lower efficiency at start up, which they are required to do if they are replacing wind plants that have stopped producing because the wind has stopped blowing.) Conversely I have chosen the "typical" coal plant as opposed to the supercritical water type coal plant, some of which operate, with SO2 and NOx scrubbers, the latter plant being slightly less noxious than the former in terms of air pollution including carbon dioxide.
The figures are as follows: For Nuclear Energy, I have accepted 25 g CO2/kwh; for wind energy I have accepted 25 g CO2/kwh; for dangerous natural gas, I have accepted 500 g CO2/kwh and for dangerous coal, I have chosen 1100 g CO2/kwh.
First the numbers:
The United States was generating and consuming 14.71 exajoules of pure electricity in 2015; in 2005 it generated and consumed 14.6 exajoules of pure electricity. (The emphasis on “pure” reflects the fact that the consumption of total primary energy was much higher than this figure, with typical coal and nuclear plants operating at about 33% efficiency, and gas plants – at least combined cycle plants – having efficiencies in the 50% region.)
Translating these effects using Denholm’s numbers for carbon intensity, in 2005, dangerous coal burned in the US for electricity resulted in the dumping 2.21 billion tons of carbon dioxide waste into the planetary atmosphere to produce 7.25 exajoules of electricity; in 2015, dangerous coal burned in the US for electricity resulted in the dumping 1.49 billion tons of carbon dioxide waste into the planetary atmosphere to produce 4.88 exajoules of electricity. Thus the reduction in the use of dangerous coal accounted for a reduction of 722 million tons of carbon dioxide dumped into the planetary atmosphere.
Thus the reduction in annual dumping of the dangerous fossil fuel waste carbon dioxide from coal was 168% as large the total reduction in carbon dioxide waste, meaning, if one is not a member of Greenpeace and is thus able to do simple math, that carbon dioxide releases from something else increased.
And that of course, is dangerous natural gas.
In 2005, US dangerous natural gas fueled power plants were producing 2.74 exajoules of electricity, and dumping 380 million tons of the dangerous fossil fuel waste carbon dioxide into the atmosphere. In 2015, the dangerous natural gas industry, awash in enthusiasm for fracking and other “modern” technologies, was producing fuel for dangerous natural gas plants producing 4.81 exajoules of electricity and dumping 680 million tons of the dangerous fossil fuel waste into the favorite planetary waste dump, our atmosphere, the air we breathe.
And so we can see which of Socolow and Pacala’s 2004 “existing technologies,” the wedges, or wedgies, if you will, accounted for the overwhelming majority of the reduction in the release of the dangerous fossil fuel waste carbon dioxide into the planetary atmosphere. Referring to Table 1 in the paper we see it was:
5. Gas baseload power for coal baseload power.
By the way, with the possible exception of more fuel efficient cars, almost all over the other “existing technology” wedges in Table 1 in the paper are still more or less pipe dreams, the subject of trivial and silly demonstration projects here and there – for example wind generated hydrogen fueling cars – but have on a macroscopic scale, i.e. a scale that matters – proved useless.
So…um…um…um…so at least natural gas is wonderful, no?
Well that would depend on the generation in which you are living. For our selfish, self-absorbed, generation of self-indulgent and indifferent sybarites, well, I suppose we can feel all peachy and keen that we’re doing “something.” But, as I noted elsewhere, a recent commentary in the important scientific journal Nature pointed out that the real underlying assumption behind all of our energy related practices in modern times is that future generations are less valuable, less worthy, than our own. Nature:"Current models of climate economics assume that lives in the future are less important than lives today, a value judgement that is rarely scrutinized and difficult to defend..." (Nature 530, 397 (25 February 2016))
In 2005, the nuclear industry - an industry built by a previous generation and given to ours - in the United States, was producing more electricity than the gas industry, 2.82 exajoules of pure electricity, and by 2015 had risen only slightly, to 2.87 exajoules of electricity.
There is a set of people, not very bright, not very well educated, not interested enough in the world to engage in realistic analysis that might conflict with their rote pop mentality, some of which they’ve garnered from watching “Simpson cartoons,” who despise the world’s largest, by far, source of climate change gas free energy, nuclear energy.
These people have proposed inadequate, and frankly dangerous and oppressively expensive, and nevertheless massively subsidized technologies – I am of course referring to so called “renewable energy” - not as an alternative to dangerous fossil fuels, about which they couldn’t care less, but to nuclear energy.
So let's talk about the so called "renewable energy" industry. Is it replacing dangerous fossil fuel use, or is it causing dangerous fossil fuel use to continue unabated?
During the recent Presidential primary campaign we heard all kinds of noise from people who support so called "renewable energy" complaining about fracking.
Will so called "renewable energy" actually reduce the requirement for fracking, or is it possible it will make it worse?
So how does the wind industry compare to the gas industry?
In 2005, the wind industry was producing 0.064 exajoules of electricity; in 2015 it was producing 0.69 exajoules of electricity in the United States. It grew an “astounding” – if you listen to the rhetoric of its often delusional supporters – 1072% in size in ten years, and still managed to remain trivial on a scale that mattered. (This shows why the advocates of the failed, and incredibly expensive so called “renewable energy” program continuously use “percent talk” in their disastrous marketing: It is easy to double your money if you have 50 cents, very difficult to do so if you have 500 million dollars.) The reality is that the total electrical energy output of the wind industry in the United States, 0.62 exajoules - for those who can do math and thus are open to questioning this cockamamie useless Don Quixote redux – is just 33% of the increase in the use of dangerous natural gas in the last ten years, and just 14% of the total, rapidly growing, dangerous natural gas powered electrical generation industry overall. This means that the wind industry is not gaining on natural gas, it is in fact losing ground on natural gas. The reason for this is obvious:
The wind industry, since the source of its power the wind is variable, has not, cannot, and will not exist without backup power, a redundancy which advocates never include in the environmental and financial cost of this essentially useless, but expensive, industry.
Moreover, the power to replace wind energy if the wind stops blowing must be available for quick dispatch: When a coal plant is shut down – possibly because the wind is blowing – according to the “zeroth law of thermodynamics” the boiler will approach thermal equilibrium with its surroundings, with the result that it might need to burn coal for an hour or two before generating a single watt of electricity, in order to bring the boiler back up to its boiling point of pressurized water, which is higher than the temperature of water in a tea kettle or pot. (This effect will also apply to combined cycle natural gas power plants; necessarily these types of plants might operate at slightly more than half of their normal operating thermal efficiency after a shutdown for several hours after shutdown.)
In general, most power systems also operate power plants that generate electricity that is not actually utilized. This is called “spinning reserve” – power than can be dispatched in seconds if suddenly demand increases or another power plant trips suddenly, which obviously wind plants do all the time. One cannot use so called “renewable energy” as spinning reserve, since it is unreliable and the main requirement for spinning reserve is, in fact, reliability. In fact the only form of renewable energy that can serve as “spinning reserve” are hydroelectric plants – assuming there is water in the reservoirs behind the dams, an increasingly big “if” in the era of climate change.
Recently, Lake Mead hit the lowest level since it was filled. One can click on the excel link Electricity Generation by Resource Type (1983-2014 - Excel File) on the California Energy Commission's web page to learn that while California produced 51,665 GWh of hydroelectric electricity in 1995, in 2014, the state produced just 16,478 GWh of hydroelectric electricity in 2014 as a result of its unprecedented drought. This is the first time in history that wind power generation in California actually approached to within 80% the level of electricity produced by the hydroelectric industry, 78.9% as much, 12,058 GWh, not because the wind industry in California is successful, but because the hydroelectric industry is experiencing a failure.
California is well along on a nuclear phase out, lead by fear and ignorance in that State. At its peak in the year 2000, the nuclear industry in California, using reactors in two buildings, one at San Onofre and the other at Diablo Canyon, 43,533 GWh. In 2014 production in the state's sole remaining reactor, Diablo Canyon, produced just 17,027 GWh.
It is telling that in one building however, the nuclear industry was able to produce more energy than all the wind farms in the entire state, strewn as they are across vast stretches of the landscape. The fact that one small building is able to produce as much electricity as wind farms strewn across thousands of square miles ought to make some very obvious points about the environmental impact of land use, but unfortunately we live in very stupid times.
As for spinning reserve, since, as in the case of California there are places where hydroelectricity (or the trivial but much hyped concept of "pumped storage" doesn't cut the mustard, that leaves gas as the source of "spinning reserve."
A great deal has been written about the effects of so called "renewable energy" on grid stability and "spinning reserve."
I may review this issue at some future point.
Suffice it to say that people who incorrectly call themselves “Friends of the Earth” or, even more absurdly, “environmentalists” have been agitating, unfortunately successfully to shut California’s last operating nuclear plant. The problem, according to these self-described “environmentalists” who in fact know nothing at all about the environment, is that the last remaining nuclear plant in California is too reliable, meaning there isn’t room for wind power or solar power when those rare moments occur when they are actually producing at an appreciable fraction of their rated peak power. Therefore reliable power, even power that releases no carbon dioxide is unacceptable in the “minds” of these terrible people.
And when the wind doesn’t blow and the sun doesn’t shine?
Gas.
That’s right folks, one of the things that is causing the increasing reliance on gas is, in fact, precisely and totally involved with the unfortunate popularity of so called “renewable energy.” Without gas, the wind industry and the solar industry are even more useless than they already are, and as uselessness goes, these industries are avatars.
The decision to embrace dangerous natural gas by this generation is a crime against all future generations. Anyone who represents that the so called “renewable energy” industry is an alternative to dangerous fossil fuels is either lying to you, lying to themselves or both. There is zero probability that wind and solar energy, no matter how much money is thrown at them in a quixotic effort to make them significant, will lead to a reduction in the use of dangerous fossil fuels.
Zero.
As for US reductions in dangerous fossil fuel waste dumping to generate electricity and its effect on the the accumulation of these wastes in the planetary atmosphere, it has nothing at all for the planet at large. It is at best, a transient effect until the world either runs out of dangerous natural gas or places in the atmosphere to dump its waste, and efforts by people around the world to attempt an approach to the "American Life Style" have easily overwhelmed any signature the switch from coal to gas has had.
The latest data from the Mauna Loa Carbon Dioxide Observatory shows that in 2016, the accumulation of the dangerous fossil fuel waste carbon dioxide is growing at the fastest rate ever observed, an accelerating rate, a terrifying rate. I covered this point elsewhere in this space:
All time record set for week-to-week annual measurements of annual CO2 increases at Mauna Loa.
If you're grilling dead animals on a gas grille this weekend, I hope I'm not spoiling your fun. Enjoy the remainder of the holiday weekend.
109 Nobel Laureates sign a letter slamming Greenpeace.
This comes from a Pop publication, but, be that as it may, it certainly is encouraging.
100 Nobel Laureates Slam Greenpeace
How and why Greenpeace became known as an "environmental organization" is beyond me. The overall ignorance of their positions has done enormous damage to the environment and to human health and welfare since, for reasons that also escape me, people tend to take their ignorance as if it were, well, something other than ignorance, which it is not.
It's nice to see a large body of the most prominent scientists in the world fighting back.
Enjoy the upcoming holiday weekend.
All time record set for week-to-week annual measurements of annual CO2 increases at Mauna Loa.
I feel physically sick just posting this; despite my long record of arguing that the popular approach to addressing climate change is delusional, no shadenfreud is involved.
The Mauna Loa Carbon Dioxide Observatory, the oldest such observatory on this planet, recorded that on June 6, 2016, the concentration of the dangerous fossil fuel waste carbon dioxide was 4.78 ppm higher than it was on the same week the year before.
Of the 2107 data points ever reported this particular data set since 1975 (Mauna Loa's carbon dioxide observatory began making measurements in 1959) this is the absolute worst ever recorded.
I described how I monitor this data previously many times in this terrifying year of atmospheric collapse in this space, most recently, here: More of the 2016 disastrous CO2 climate year, May 29, 2016 4.16 ppm worse than May 31, 2015. Here is an excerpt from that post containing some links to earlier posts in my nightmarish posts in this series:
Of the approximately 2100 weekly year-to-year data points recorded since the 1970's before 2016 there were only 7 which were higher than 4.00 ppm, one in 2010, one in 2012, one in 2013, one in 2014, and three occurred in 1998, as a result, most probably, of the massive fires in Southeast Asia.
There are now fifteen such data points, with eight occurring this year, and, um, we're only halfway through it.
Some remarks from previous posts on 2016, which is rapidly shaping up as an unparalleled disaster for the accelerating accumulation of the dangerous fossil fuel waste carbon dioxide in the planetary atmosphere:
Right now, if trends continue, 2016 will blow that level away.
Something very, very, very, very disturbing is happening if the Mauna Loa observatory's CO2 measurements are correct.
For clarity, I will repeat some text from one of my earlier posts, showing how I store and analyze this data available from the Mauna Loa observatory's website's data tab:
The data goes back to 1974, and comprises 2,090 data points.
I import this data into a spreadsheet I maintain each week, and calculate the weekly increases over the previous year. I rank the data for the increases from worst to best, the worst data point being 4.67 ppm over the previous year, which was recorded during the week ending September 6, 1998, when much of the rain forest of Southeast Asia was burning when fires set to clear the forests for palm oil plantations got out of control during unusually dry weather. Six of the worst data points ever recorded occurred in 1998 during this event, another was recorded in the January following that event.
Of the twenty worst data points ever recorded out of 2090 two of them have occurred in the last four weeks. The week ending January 31, 2016 produced a result of a 4.35 ppm of increase. The week just passed, that ending, 2/14/2016, produced a result of 3.79 ppm increase, tying it for the aforementioned week in January 1999, that ending on January 24, 1999, and that of January 2, 2011.
Of the twenty highest points recorded, 9 have occurred in the last 5 years, 10 in the last 10 years.
It's looking very bad these last few weeks at the Mauna Loa carbon dioxide observatory.
The above comes from a post in this very, very, very depressing series on May 1 of this year: For April 2016, the average weekly increase in CO2 levels compared with April 2015 is 4.16 ppm
As described above, the data set now comprises 2107 data points, and that of June 6 of this year is the worst ever recorded.
The previous worst data point ever recorded was 4.67 ppm, measured on September 6, 1998, 1998 having been, until it was displaced by 2015, the worst year ever recorded for carbon dioxide increases, owing to vast destruction of the South East Asia rain forests, after fires set by people setting to clear land for palm oil plantations to make "renewable" biofuels got out of control and burned huge swathes of these forests.
It is very clear that 2016 will blow away the 2015 record - 3.05 ppm higher than 2014 - as well as that of 1998.
Of the 10 worst such data points recorded for week to week comparisons of previous years, six of the worst 10 have occurred in 2016.
Fourteen of the worst 30 have been recorded in the last 5 years, 18 of the worst 30 have been recorded in the last 10 years. Thirteen of the worst 30 occurred in 2016.
The average of all these data points recorded since 1975 is 1.75 ppm; the average for the 20th century was 1.54 ppm; for the 21st century, it is 2.07 ppm, for 2015 - the worst year ever recorded - it was 2.25 ppm. For 2016, the average is now 3.54 ppm. Over the last 4 weeks the average is 4.26 ppm.
Since Japan shut it's nuclear reactors to see if they're "safe" after Fukushima - and replaced the power with that generated in dangerous fossil fueled plants which kill people whenever they operate and not just in accident situations - the average increase is 2.32 ppm.
If any of this bothers you, don't worry, be happy. The dangerous fossil fuel exporting country Norway ran a wind to hydrogen plant on the island of Utsira for a few years back in the earliest years of this century to "demonstrate" how we "could" store wind energy if, um, we wanted to do so. It produced enough hydrogen to power ten homes. The number of industrial scale wind to hydrogen plants built to power a million homes, never mind hundreds of millions of homes, is zero, but, um, lessons were learned.
The wind and solar industries have proved completely useless in addressing climate change, despite trillions of dollars sunk into them. As the data shows, they haven't worked; they aren't working; they won't work, but results don't matter. It's the thought that counts.
I wish all the fathers out there a wonderful and happy fathers day. During my fathers day lunch I discussed this data with my two sons and my wife, but I'm not sure people of my generation should feel comfortable looking people of their generation or any future generation in the eye.
I also wish anyone not involved in father's day, a pleasant Sunday afternoon and evening.
We must never forget that the scientific and technical accomplishments of today...
...are not the exclusive products of this generation. They are the results of the labors and the thoughts of countless individuals over the centuries. They are the sum and substance of that continuous wave of progress to which each generation has made its contribution. Thus, it is incumbent on us not only to safeguard this precious heritage-one of the highest expressions of man’s unselfish achievement-but to enrich it with our own particular contribution and ensure its transference to our successors.”
A few years back, through a set of unusual circumstances, a friend of mine arranged it so that I could spend a few hours in a late November afternoon in the office of Freeman Dyson at the Institute of Advanced Studies with my two sons and one of my son's friends. It was, as one might expect, an extremely memorable visit, in which he graciously afforded us a few hours. Our conversation drifted over a wide range of subjects, many of which concerned his wide ranging scientific work both practical and theoretical. As I am extremely interested in nuclear power, regarding as the last, best, technical hope for the human race as we fall into the environmental abyss, and Dyson, besides his huge contributions to pure physics, was a pioneer in the development of nuclear reactor technology.
One of his major contributions was the development of hydride fuels - in the 1950's - which have many passive control features owing to their self moderating properties. These fuels have played a huge role in research reactors at educational institutions and in the preparation of radioisotopes for use in medicine and other areas of science. When I asked Dyson about this fuel and his role in it, he was self deprecating, and denied having what he regarded as a "major" role in the development, offering - I paraphrase "I just did a little bit of physics, the hard work was done by Massoud Simnad."
Massoud Simnad, born a citizen of Iran, was a Professor of Engineering at UCSD and also worked at General Atomics in the beautiful complex in La Jolla up on Torrey Pines Blvd. (I once worked in the complex myself, but I was working for a biotech that had rented space, and not in the nuclear field.)
I was poking around this morning in some files I'd collected but not indexed a few years back and I came across a paper of Simnad's written in the early 1980's. In that paper he quotes John J. Hopkins, the founder of General Atomics.
The text of his wonderful introduction to the paper, A BRIEF HISTORY OF POWER REACTOR FUELS (Journal of Nuclear Materials 100 (1981) 93-107), is more completely excerpted here:
The section I have bolded, it seems to me as I approach the end of my time on Earth, has been the greatest failure of my awful generation that has done great harm to all future generations because of a focus on trivialities and consumption for its own sake. Among those great failings was to regard Simnad's work, as well as the work of the many intellectual giants who founded and developed nuclear energy, through a prism of fear and ignorance.
The power of fear and ignorance to cause tragedy has been a great theme in human history, now more than ever. This is only one case, if an important one.
Have a nice Sunday.
Profile Information
Gender: MaleCurrent location: New Jersey
Member since: 2002
Number of posts: 33,516