NNadir
NNadir's JournalGlobal human-made mass exceeds all living biomass
(Graphics in this post may not be visible in Google Chrome, but should show up in Microsoft Edge, Firefox and Android.)
The paper I'll discuss in this post is this one: Global human-made mass exceeds all living biomass (Emily Elhacham, Liad Ben-Uri, Jonathan Grozovski, Yinon M. Bar-On & Ron Milo, Nature volume 588, pages 442–444 (2020))
The current rate at which we are dumping the dangerous fossil fuel waste carbon dioxide into the atmosphere amounts to roughly 35 billion metric tons a year, this while we all wait with child like anticipation for the grand so called "renewable energy" nirvana that did not come, is not here, and will not come. This is the highest rate ever recorded, and is reflected by the fact that increases in the concentration of this particular dangerous fossil fuel waste in the planetary atmosphere has risen to 2.4 ppm/year, after being 1.6 ppm/year as recently as the year 2000.
The irresponsibility of my generation, which surely will be condemned in history, has meant that the only option for restoration of the planetary atmosphere will involve the removal of carbon dioxide from the atmosphere, and I have spent no inconsiderable amount of time reflecting on the feasibility of this enormously challenging engineering task. In a purely thermodynamic sense, the fixation of carbon dioxide requires not only enthalpy, which may be thought of, somewhat naïvely, as putting the energy released by combustion of the carbon in carbon dioxide back into it, but also the entropy of mixing, the fact that while the carbon dioxide concentrations are rising, with the result of a profound physicochemical effects on heat exchange and acidity, they are still dilute. The 420 ppm we will likely see in 2021 while reaching unprecedented levels, still is only present as 0.042% of air.
This means that to obtain one kilogram of carbon dioxide at 100% extraction efficiency - which is not likely - one would need to process over 2,000 kg of air. Large amounts of air are processed by devices built by humans, but most of them, in fact the overwhelming majority of them, add carbon dioxide to the air since they are combustion devices. A jet engine is an example of such a device, a heat engine operating on the Brayton cycle, where the air is heated by the combustion of jet fuel in it.
(It does seem fairly obvious to me that Brayton cycle devices might operate without dangerous fossil fuels, but that's another subject.)
The situation is ameliorated to a limited extent by the fact that water, in particular seawater, acts as a liquid extractant for CO2, in equilibria with carbonates, as seawater is slightly basic, although less so than it was even 50 years, even 10 years, ago. The rate of change for the pH of the oceans is estimated to be about -0.002 pH units/year, which is not trivial, since pH is a logarithmic function. (cf. Climatological distributions of pH, pCO2, total CO2, alkalinity, and CaCO3 saturation in the global surface ocean, and temporal changes at selected locations (Taro Takahashi, S.C. Sutherland, D.W. Chipman, J.G. Goddard, Cheng Ho, Timothy Newberger, Colm Sweeney, D.R. Munro, Marine Chemistry 164 (2014) 95–125)). Of the roughly 35 billion tons of carbon dioxide dumped each year, alleged - in complete opposition to something called "reality" - to be "transitional" by the complete fools who have bet the planetary atmosphere and the future of the biosphere on their reactionary enthusiasm for so called "renewable energy," about 26 billion tons of CO2 are absorbed by the ocean each year. (cf. Total alkalinity minus dissolved inorganic carbon as a proxy for deciphering ocean acidification mechanisms (Liang Xue, Wei-Jun Cai, Marine Chemistry 222 (2020) 103791)). This paper, citing Climatological distributions of pH, pCO2, total CO2, alkalinity, and CaCO3 saturation in the global surface ocean, and temporal changes at selected locations out of Columbia University, (Takahashi et al., Marine Chemistry 164 (2014) 95–125), gives a working figure of 2061 ?mol/kg of total dissolved inorganic carbon. This figure translates to about 0.11% w/w dissolved organic carbon. This figure corresponds to seawater containing about 260 times as much carbon dioxide as does air on a weight basis. It is important to note that seawater is not homogenous, and the precise concentrations vary with conditions such as temperature gradients, pressure gradients, salinity gradients and many other factors connected with the properties of seawater. All of these parameters will have an effect on the chemistry and concentrations of dissolved inorganic carbon. A great deal of scientific literature has been equations of state for seawater, and international consortiums have worked diligently to address and formulate these. The current equation of state for seawater often utilized is TEOS-10 Just a single sample, among thousands upon thousands, of papers relating to either the measurement or modeling of seawater, this one about density is this one: (p,?,T) Properties of seawater at brackish salinities: Extensions to high temperatures and pressures (J. Safarov, S.Berndt, F.J.Millero, R.Feistel, A.Heintz, E.P.Hassel, Deep-Sea Research I 78( 2013) 95–101) This interesting paper extends the equation of state for seawater into regions approaching the supercritical state, which in my view, represents the best path to recovering carbon dioxide, and many other valuable constituents, notably phosphorous, from seawater.)
The actual chemical form of dissolved inorganic chemistry depends heavily on pH, temperature, density and other thermophysical properties of seawater, but these forms are dominated by carbonate, bicarbonate, and CO2 clathrates. This figure from the Xue and Cai paper cited above, gives a feel for this issue:

The caption:
The laws of thermodynamics dictate that processes of this type are not actually reversible without putting more energy into a system than it put out. Thus the energy required to remove carbon dioxide from the air will be greater than the energy released putting it there, but the extraction of carbon dioxide by seawater will surely aid in improving the thermodynamic efficiency of any such effort. Thus future generations, attempting to do this will need not only to provide energy for their own use, but also produce all of the energy produced by previous generations in the profligate use of dangerous fossil fuels. As we prattle on with our "by 2050" and "by 2100" and "by 'such and such a year'" obscenities, placing the onus on people who are now infants, or future infants to do what we have been unable to do ourselves, this with depleted resources and a destroyed environment, it is important to keep this dolorous fact in the backs of our minds.
The reason that so called "renewable energy" has not worked, is not working and will not work to address climate change or save the planet, and why humanity abandoned it almost completely (except for, in most cases, among extremely impoverished people) in the 19th and early 20th century, is that it has a low energy to mass ratio. The conceit among people hyping the failed solar industry, for example (failure being defined as addressing climate change, and not the wasteful exchange of money and resources) is to state the energy to area flux of sunlight and then to act, stupidly, as if it is all there for the taking taking at no environmental or material cost. In addition to the 35 billion tons of carbon dioxide, according a lecture I attended a year or so ago by Dr. Robert Kopp, about 10 billion tons of carbon dioxide in addition to that dumped by the rising use of dangerous fossil fuels is attributable to land use changes. Ploughing access roads through pristine wilderness for diesel trucks to haul wind turbine parts around is not climate neutral. The material cost of manufacturing this temporary crap is also a factor.
All this said, this brings me to the relevant point, in terms of the paper cited at the outset, specifically, biomass. The combustion of biomass is responsible for slightly less than half of the 6 to 7 million air pollution deaths that take place each year, while anti-nukes carry on about so called "nuclear waste," which has a spectacular record of killing, if anyone, only a few people. (When you ask anti-nukes to report how many deaths are associated with the storage of used nuclear fuel, they generally start mumbling insipid nonsense about thousands, millions and even billions of years from now. They suffer from Trumpian type delusions.) Thus the death toll associated with this particular form of so called "renewable energy," at least as currently practiced, makes it the most dangerous of all of them, not that the others are risk free.
However, biomass has the property of being self-replicating, thus being able to cover vast surface areas without human intervention, or in spite of human intervention, which it historically it has, despite human efforts to minimize or destroy these surface areas. My contempt for solar energy fantasies notwithstanding, biomass, albeit at low thermodynamic efficiency, because of its ability to cover large surface areas, is capable of, and obviously is, a potentially very useful tool for the removal of carbon dioxide from the air, using only solar energy. Understanding this, I have spent quite a bit of time studying the chemistry, in particular, of cellulose and lignin derived products, such as furanoyl compounds, aromatic species, notably phenolic polymers, as these products can represent carbon that is sequestered in an economically viable, in fact, value added fashion. It is generally true that processes exploiting biomass need not be anywhere near as deadly as is currently observed, where the victims are largely the poorest citizens of the world, on whom the first world relies to produce endless piles of stuff in quasi-slavery or actual slavery settings.
Of course, the carbon released largely in the last two centuries by the combustion of dangerous fossil fuels represents many hundreds of millions of years of captured solar energy, and so it is not reasonable to expect that photosynthesis will instantaneously address the scale of carbon that needs to be captured, but this said, it is not wise to ignore the potential to do something. I would guess that humanity will still need industrial means, for example, raising the temperature of seawater to supercritical levels using nuclear heat, thus separating dissolved inorganic carbon, oxidizing microplastics to carbon dioxide and reducing water to hydrogen, that now pollute our oceans, and providing fresh water to fossil freshwater groundwater, dried lakes, and agricultural regions.
In order to evaluate the potential to do this, it is useful to note how much biomass there is, which is something the paper at the outset addresses, while noting that human "stuff" now outstrips the amount of biomass on the planet.
From the introduction to the paper:
A case in point is our planet’s biomass. While the mass of humans is only about 0.01% of global biomass, our civilization had already had a substantial and diverse impact on it by 3,000 years ago9. Since the first agricultural revolution, humanity has roughly halved the mass of plants, from approximately two teratonnes (Tt, units of 10^(12) tonne; where estimates are on a dry-mass basis) down to the current value10 of approximately 1 Tt. While modern agriculture utilizes an increasing land area for growing crops, the total mass of domesticated crops (about 0.01 Tt)11 is vastly outweighed by the loss of plant mass resulting from deforestation, forest management and other land-use changes10. These trends in global biomass have affected the carbon cycle and human health12,13. Additional human actions, including livestock husbandry, hunting and overfishing, have also strongly affected the masses of various other taxa11,14,15. A recent survey of Earth’s remaining living biomass11 has found that, on a mass basis, plants constitute the vast majority (about 90%)16, followed by bacteria, fungi, archaea, protists, and animals.
Beyond biomass, as the global effect of humanity accelerates, it is becoming ever more imperative to quantitatively assess and monitor the material flows of our socioeconomic system, also known as the socioeconomic metabolism17,18. This quantification is at the heart of the economy-wide material flow analysis framework, under the field of industrial ecology, which is based on mass balance accounting19,20...
There you have it. The total dry biomass of the planet represents about a trillion tons, only a portion of which is carbon. (Carbohydrates, which dominate biomass, contain only about 40% carbon by weight.) It can be shown, crudely assuming as a first approximation that all of this biomass is represented by carbonhydrates, that this corresponds to about 1.4 trillion tons of carbon dioxide, were all of the carbon in these putative carbohydrates oxidized. In other words, all of the biomass on the planet, every living thing, contains, assuming 30 billion tons of carbon dioxide dumping per year on average over the last century, about 50 years worth of dumped carbon. Of course, you, the readers, are biomass, and I'm fairly well convinced that you will not desire to be reduced to sequested carbon to serve the cause of addressing climate change, even if - this is true - climate change threatens your life in other ways.
Further on down, the paper does address the mass of humanity, and the animals raised by humanity along with some other commentary:
Some figures from the text:
Fig. 1: Biomass and anthropogenic mass estimates since the beginning of the twentieth century on a dry-mass basis.
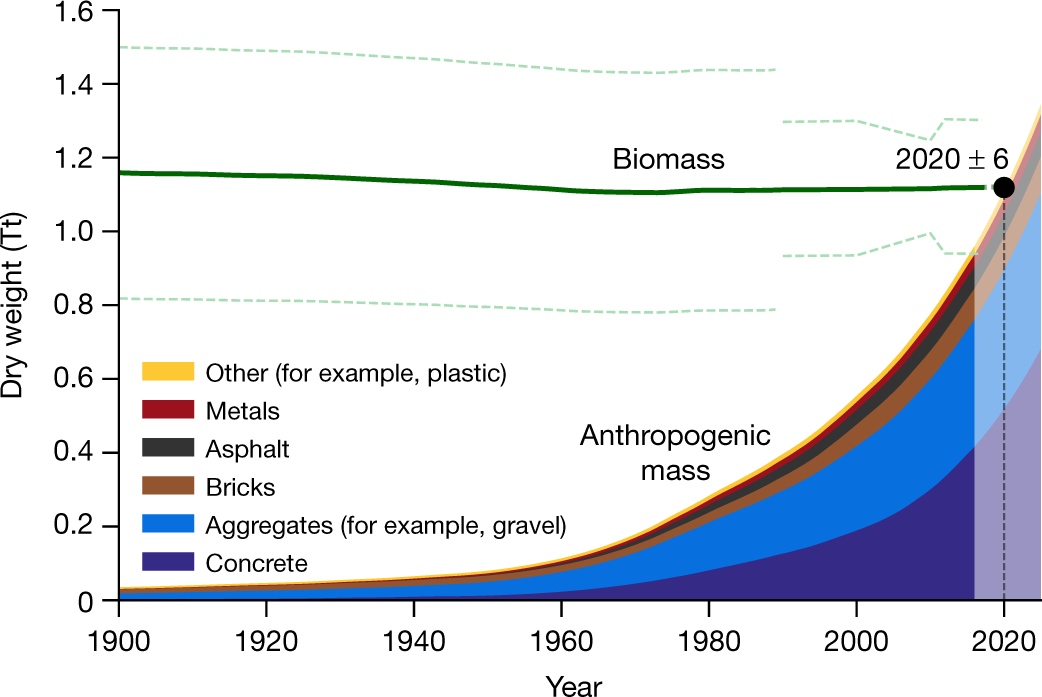
The caption:
Our waste, how we love waste, counts too.
Fig. 2: Biomass (dry and wet), anthropogenic mass and anthropogenic mass waste estimates since the beginning of the twentieth century.
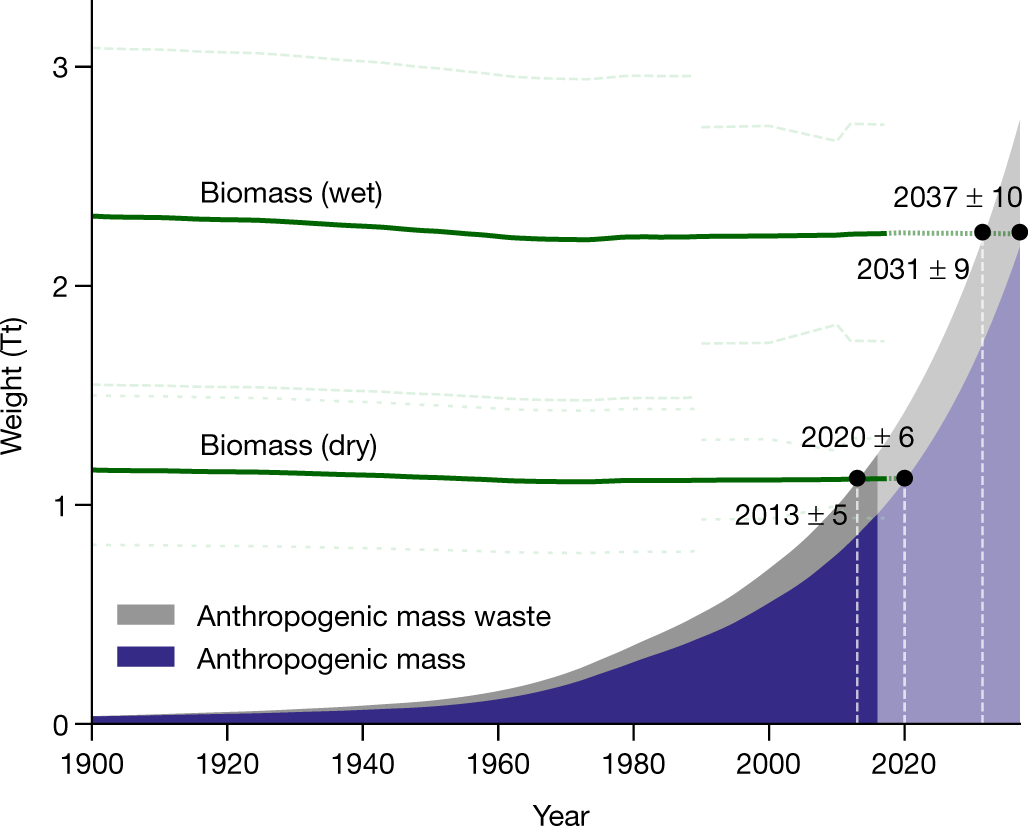
The caption:
Fig. 3: Contrasting key components of global biomass and anthropogenic mass in the year 2020 (dry-weight basis).
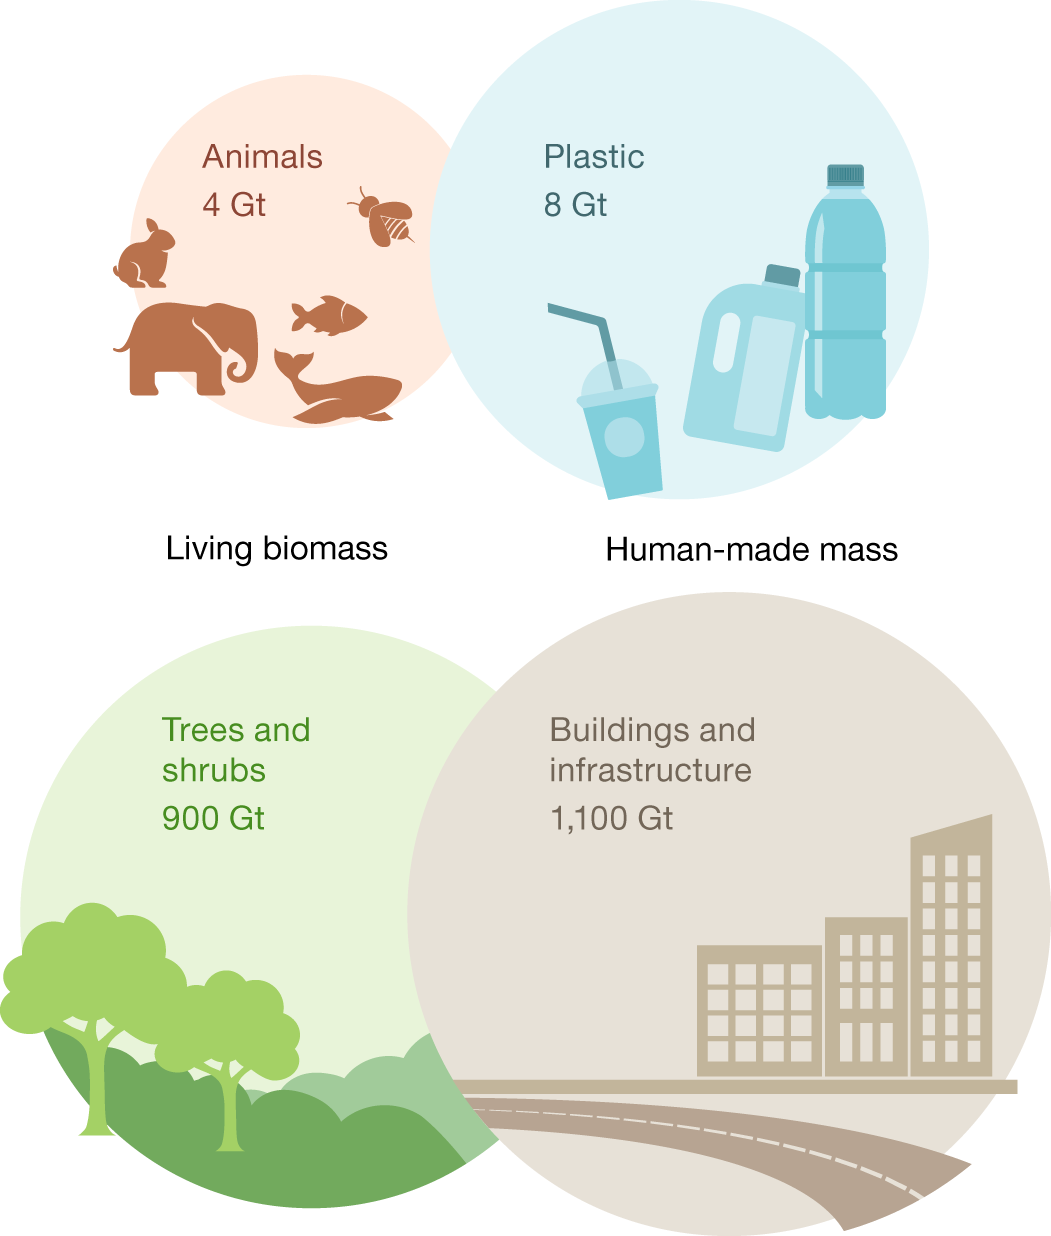
These figures speak for themselves.
From the conclusion of the paper's discussion section:
This study joins recent efforts to quantify and evaluate the scale and impact of human activities on our planet9,23,27,28. The impacts of these activities have been so abrupt and considerable that it has been proposed that the current geological epoch be renamed the Anthropocene29,30,31,32. Our study rigorously and quantitatively substantiates this proposal. In parallel, it adds another dimension to this discussion—a symbolic quantitative demarcation of the transition to our epoch.
Don't worry, be happy. Wind turbines. Solar cells. Tesla electric cars, "freedom of the road." Batteries. Blah, blah, blah. It's not our problem, but the problem of those "by 2100" kids in the renewable energy nirvana we've declared for them, albeit with oblivious contempt for reality and, especially, for them.
I note that the history of our times will be written by them. As I often say:
I trust you will have a safe and happy New Year.
Who wants to bet that the Nashville terrorist proves to be a right wing terrorist?
Undoubtedly Trump will refer to that person as a very fine person.
Capacity Factor of California's Solar Infrastructure 12/24/20 Through 22:10 PST.
According to the web page of the California Energy Commission, California has installed 11,089.2 MW (peak) of solar energy capacity.
At the CAISO "supply" page, which reports on the power output of all power sources in the state, if one scrolls down to the graphic for so called "renewables" one can see a drop down data button, which records the power output of all forms of so called "renewable energy" in the state, measured in increments of five minutes.
As of 22:10 PST, 12/23/20 (10:10 PM), the average power for all of California's solar facilities was . This suggests a capacity utilization of 8.9%.
The highest solar power output was observed at 3755 MW observed this afternoon (PST) at 13:25 PST (1:35 PM). The lowest output was continuously from 16:55 PST through 17:20 PST (4:55 PM PST through 5:20 PST) , was -47 MW through each 5 minute interval. The standard deviation was actually greater than the mean - reflecting huge variability and unreliability for the 5 minute segments; it was is 1422 MW. (The negative values for the minima refer to the energy losses associated with power flowing to the power lines that service the solar facilities when the sun isn't shining.)
For wind power, the mean was 890 MW, with a high of 1486 MW at 4:15 PST (4:15 AM), a low of 445 at 15:10 PST (3:10 PM PST), with a standard deviation of 314 MW.
The performance of California's so called "renewable energy" infrastructure is shown in the following graphic which, regrettably will not show up in Google Chrome, but will be visible in Microsoft Edge and or Firefox or Android:

California's peak energy demand on 12/24/20 was observed at 17:45 PST (4:45 PM PST) and was 27,632 MW. At this point, solar energy power lines were sucking 44 MW of power out of the grid to the then useless connections to the solar cells lying in the dark, doing nothing.
As I noted a few days ago on the solstice, the single operating nuclear reactor at Diablo Canyon - one unit is shut currently, probably for refueling - has continuously been producing between 1141 and 1144 MW. It is producing the same power today as it was 4 days ago, continuously, with a trivial fluctuation, reliably and predictably. The highest output today was 1145 MW; the lowest 11.41. The standard deviation is 0.9 MW, reflecting high reliability
This means that were both Diablo Canyon units operating, these two reactors could have easily provided all the energy provided by wind power today, with the added bonus of being predictable and reliable, in two small buildings, using only two turbines, and largely without the vast array of wires that crisscross California and need to be shut when the wind is blowing too strongly on dry days, lest they cause another of the huge fires we've seen in the last few years in that State.
As of 22:40 PST, California generating facilities were dumping 8,469 tons per hour of the dangerous fossil fuel waste carbon dioxide directly into the atmosphere. At that time, California was generating 12,858 MW of power using dangerous natural gas. The website emissions page includes the emissions associated with imported electricity.
All of the wind and solar capacity in California will need, more or less, to be replaced by 2040, since the average lifetime for these so called "renewable energy" devices is roughly 20 years.
The Diablo Canyon nuclear reactors came on line in early 1985 (Unit One) and 1986 (Unit 2), 35 years ago. They are being shut, in 2024 and 2025, prematurely and not because they couldn't operate longer thus saving lives, but because of appeals to public ignorance.
In 35 years of nuclear operations, the number of people killed by storage of the boogey man used nuclear fuel, often referred to, with some measure of stupidity as "nuclear waste" at Diablo Canyon has been zero. The number of people who have died from air pollution in California is not zero.
The closure of the Diablo Canyon nuclear reactors represents a crime against humanity, inasmuch as it will increase air pollution and worsen climate change. California's power plants dumped over 51,049,896 tons of carbon dioxide into the planetary atmosphere in 2019, and that was a "good year."
These are facts. Facts matter.
I trust that those who are celebrating the Christmas holidays will enjoy a Merry Christmas and a Happy New Year.
Capacity Factor of Wind Energy Facilities in California 12/23/2020
According to the California Wind Energy Association "Fast Facts," California has a minimum of 5,535 MW of installed wind capacity.
At the CAISO "supply" page, which reports on the power output of all power sources in the state, if one scrolls down to the graphic for so called "renewables" one can see a drop down data button, which records the power output of all forms of so called "renewable energy" in the state, measured in increments of five minutes.
As of 20:55 PST, 12/23/20 (8:55 PM), the average power for all of California's wind turbines was 2003 MW. This suggests a capacity utilization of 36.2%.
The highest power output was observed at 2541 MW observed this morning (PST) at 10:20 PST (10:20 AM). The lowest output was at 20:35 PST (20 minutes before downloading of the file.) The standard deviation for the 5 minute segments is 363 MW
As I noted a few days ago on the solstice, the single operating nuclear reactor at Diablo Canyon - one unit is shut currently, probably for refueling - has continuously been producing between 1141 and 1144 MW. It is producing the same power today as it was 4 days ago, continuously, with a trivial fluctuation, reliably and predictably. The highest output today was 1145 MW; the lowest 11.41. The standard deviation is 0.9
This means that were both Diablo Canyon units operating, these two reactors could have easily provided all the energy provided by wind power today, with the added bonus of being predictable and reliable, in two small buildings, using only two turbines, and largely without the vast array of wires that crisscross California and need to be shut when the wind is blowing too strongly on dry days, lest they cause another of the huge fires we've seen in the last few years in that State.
As of 21:30 PST, California generating facilities were dumping 9,846 tons per hour of the dangerous fossil fuel waste carbon dioxide directly into the atmosphere. At that time, California was generating 12,858 MW of power using dangerous natural gas. The website emissions page includes the emissions associated with imported electricity.
The average power output of all solar facilities in California, Arnie Schwarzenegger's "million solar roofs" included, was 2,483 MW, the high being 8,222 MW at 13:20 PST (1:20 pm PST) and the lowest being a negative number to account for losses to the connecting lines was -45 MW 17:20 PST (5:20 PM PST). This minimum was observed a 36 minutes before the peak demand for electricity in California, which was observed at 17:56 was 29,089 MW. At 5:30, when the solar connection lines were sucking 45 MW of power out of the grid, demand was 28,612 MW. The standard deviation for solar power output over the period reflecting the time I downloaded the spreadsheet was 3,321 MW.
All of the wind and solar capacity in California will need, more or less, to be replaced by 2040, since the average lifetime for these so called "renewable energy" devices is roughly 20 years.
The Diablo Canyon nuclear reactors came on line in early 1985 (Unit One) and 1986 (Unit 2), 35 years ago. They are being shut, in 2024 and 2025, prematurely and not because they couldn't operate longer thus saving lives, but because of appeals to public ignorance.
In 35 years of nuclear operations, the number of people killed by storage of the boogey used nuclear fuel at Diablo Canyon has been zero. The number of people who have died from air pollution in California is not zero.
The closure of the Diablo Canyon nuclear reactors represents a crime against humanity, inasmuch as it will increase air pollution and worsen climate change. California's power plants dumped over 51,049,896 tons of carbon dioxide into the planetary atmosphere in 2019, and that was a "good year."
The vast world wide "investment" in so called "renewable energy" - this on a trillion dollar scale - has done absolutely nothing to address climate change. In fact, since these investments began scaling to billion dollars a year scale, beginning in the early 21st century, the rate of increases measured at the Mauna Loa CO2 Observatory have accelerated.
Reference for the "investment" scale for so called "renewable energy:" UNEP/Bloomberg Global Investment in Renewable Energy, 2019
These are facts. Facts matter.
I trust that those who are celebrating the Christmas holidays will enjoy a Merry Christmas and a Happy New Year.
I'm getting tested for Covid tomorrow.
Someone with whom I work tested positive as did her husband. I'm told she's not sick, but her husband is mildly ill.
I'm a little annoyed, because while everyone at work has been wearing a mask, she was one of the people who kept pulling it down from her nose. We've had a few people who test the limits, and she was one.
It's especially annoying because I'm high risk, and I distributed the secret Santa gifts, being white haired and fat, dressed as Santa Claus. I was heavy on the hand sanitizer handling the gifts, and wearing a mask over the beard, but still...
My wife tells me if the test - it's a PCR - doesn't hurt, it's not good. She keeps pointing out to me that the test is painful to get; if you don't wince when they poke the swab up your nose, it doesn't count. That's great of her to let me know, since I'm a big baby. I love her anyway.
It would be good to know if I have it of course, particularly if I have one of those nice mild strains that are going around. Other than a stuffy nose, I feel great. It would, of course, be even better to learn that I do not have it.
At my age, one feels one's mortality in all sorts of ways beyond this, but in the worst case, were I to kick off, I can have no regrets, as my life has been fabulous indeed, better I think, than I actually deserved.
I hope, of course, not to go just yet. It would be a wonderful cap to a wonderful life to see the fat idiot orange racist out of the White House and being dragged, whining and screaming, through a legal system under the restored rule of law.
Then again, during the last US Civil War, many of the people who died to determine the outcome didn't live to see that outcome, but it all turned out alright, in a sense, anyway. That first Civil War our nation's first necessary major strike against our intrinsically racist history, and if I don't live the outcome of this present cold (as of yet) Civil War, I am confident that the American people will ultimately prevail against the crimes of our past, and in so doing, become a better country. It is well that we faced this down, this hydra of racism that the pustule Trump brought to the surface, here and now, and and I trust Americans, real Americans, will continue to face it down.
Decreased COVID-19 Mortality--A Cause for Optimism
From the JAMA newsfeed, invited commentary:
Decreased COVID-19 Mortality—A Cause for Optimism
Excerpts:
Similar improvements in mortality due to COVID-19 have been seen in other studies. A study using national intensive care unit data from the UK2 found a reduction in mortality from 41.4% in March 2020 to 24.8% in June 2020, and a study of patients with COVID-19 in a single hospital system in New York City, New York3 reported that hospital COVID-19–adjusted mortality dropped from 25.6% to 7.6% between March and August 2020. These improvements in mortality likely represent multiple clinical, health care system, and epidemiologic trends...
...Asch and colleagues1 found that mortality rates were higher when the community prevalence of COVID-19 was higher. One likely reason for this finding is that hospitals do not perform as well when they are overwhelmed. In particular, patients with a precarious respiratory status require expert, meticulous therapy to avoid intubation; those who undergo intubation or have kidney failure require nuanced and timely expert care with ventilatory adjustments and kidney replacement therapy, which are difficult to perform optimally when hospital capacity is strained.
Bad news for rural hospitals in the mask adverse Republicastan regions.
The full Asch paper to which the commentary refers can be found here: Variation in US Hospital Mortality Rates for Patients Admitted With COVID-19 During the First 6 Months of the Pandemic (Asch DA, Sheils NE, Islam MN, et al. Variation in US Hospital Mortality Rates for Patients Admitted With COVID-19 During the First 6 Months of the Pandemic. JAMA Intern Med. Published online December 22, 2020. doi:10.1001/jamainternmed.2020.8193)
It appears that only one of the two remaining nuclear reactors in California is operating tonight.
(Graphics in this post will not show up in Google Chrome, but should be visible in Microsoft Edge and/or Firefox.)
Both reactors are located at the Diablo Canyon plant; I would guess that one is refueling for its final run before it's shut and replaced by dangerous natural gas, probably accompanied by wide cheering by people who don't know shit about climate change, or for that matter, about the number of deaths caused daily from air pollution. (Hint: More people die every day from air pollution than die from Covid-19 on Covid-19's worst day.)
Around the equinox, I took it upon myself to download graphics at various times of the day from the CAISO website.
I kind of put that project on the back burner, but I have been reminding myself to check in on California's electricity profile around the winter solstice, which is today.
California is rather unique among the various so called "renewable energy" nirvanas all around the world as we surge toward 420 ppm of the dangerous fossil fuel waste carbon dioxide in the atmosphere. It's one of the few places where solar electricity routinely produces more instantaneous power than does wind, usually between 7 am and 6 pm, although in the early morning the solar energy supply is trivial, as it is in the late afternoon. Peak demand in California begins in late afternoon to early evening time frame, most days if you look.
As of 18:45 PST here are today's power supply graphically displayed as of 18:45 PST 12/21/20:

The grey line near the bottom is the single nuclear reactor operating right now at Diablo Canyon in one building. If you use the pop up on the live website, you will see that the power output at Diablo Canyon's single operating reactor has varied only by 3 MW, from 1,141 MW to 1,144 MW, more or less, continuously, all day, all night.
Here is the so called "renewable energy" output for all the renewable energy systems in California, again as of 18:45 PST 12/21/20

It appears that as of 18:45 the single reactor operating at Diablo Canyon is producing more power than all of the wind and solar facilities in the entire state, reliably.
Each evening the solar output goes (slightly) into negative territory because of power losses to all the power lines connecting Californias so called "renewable energy" infrastructure. As of 18:45, these power losses amounted to -39 MW. All of the wind turbines in California, combined, were producing 534 MW of power, less than what a single turbine in a moderately sized power plant can produce. This means that the overwhelming amount of the copper, steel, neodymium iron boride magnets in all of California's wind turbines represents stranded assets, doing nothing, producing nothing. California has laced itself densely with power lines to service all that wonderful so called "renewable energy" infrastructure. On very windy days, these wires have to be disconnected, lest they spark and cause a fire, big fires, like those we've been seeing in recent years, as climate change worsens at an ever increasing pace.
As of 18:45 12/21/20, California was dumping 10,542 metric tons of CO2 per hour into the planetary atmosphere to power its grid.
2020's atmospheric concentrations peaked during the week beginning May 24, 2020 at 417.43 ppm. I would estimate, having followed the figures at the Mauna Loa Carbon Dioxide Observatory closely for many years that in May of 2021 will end up somewhere around 420 ppm. The current 12 month rolling average for 10 year increases (measured weekly) in carbon dioxide concentrations is now at 24.13 ppm/10 years, or 2.41 ppm per year. 2.4 ppm per year is the fastest such rate of increase ever observed.
There's a little bit of noise in these figures, which is understandable.
Oh, in case, you're thinking that Covid impacted climate change, it didn't all that much.
Near the end of December, 2002 - I started writing here in 2002, the 12 month rolling average for 10 year increases was 16.81 ppm/10 years, or 1.68 ppm/year. In the week of December 22, 2002, the concentration of the dangerous fossil fuel waste carbon dioxide in the planetary atmosphere was 374.25 ppm. The most recent reading at the Mauna Loa website (Week of 12/13/20) was 413.92.
For the 18 years I've been writing here, arguing for nuclear energy, I've been hearing how nuclear energy wasn't necessary, because solar, wind, geothermal and wave energy would save the day.
They didn't.
These are facts. Facts matter.
I trust you are enjoying, in spite of the Covid plague, the run up to the holidays.
Someone here recommended the movie "Uncle Frank."
I forwarded the recommendation to my wife who watched it and then made me watch it.
It was a very moving film.
Whoever recommended it, thank you.
Reanimating Queen Elizabeth, Anne Boleyn, Abraham Lincoln and Others Using Photos and AI.
Another of Nature's 10: Uruguay's Gonzalo Moratorio: Coronavirus hunter
From Nature’s 10: ten people who helped shape science in 2020, (Nature, December 14, 2020.)
Excerpt:
They are grateful because Moratorio helped Uruguay dodge the worst consequences of the pandemic. Moratorio, a virologist at the Pasteur Institute and the University of the Republic, both in Montevideo, and his colleagues designed a coronavirus test and a national programme for administering it that has helped to keep COVID-19 cases at bay as outbreaks have swept through Latin America — including Uruguay’s closest neighbours, Argentina and Brazil. Uruguay continues to record one of the world’s lowest death tolls — only 87 people by 10 December.
“We’re some sort of outlier,” he says. “We’re buying time. And all the time we buy will be precious until drugs or vaccines arrive.”
Moratorio was excited to start the year as head of his own laboratory for the first time, having completed a postdoc in Paris in 2018. He was planning to study how viruses mutate and how to make them less harmful. But in the first days of March, he and other Pasteur researchers from across the Americas met online to discuss what to do about the rapidly growing coronavirus outbreak.
Some researchers weren’t terribly worried. Carlos Batthyány, a pharmacologist who leads the Pasteur Institute of Montevideo, told his colleagues that he thought Uruguay would be largely spared by the pandemic. “I wasn’t very convinced of the impact it would have,” he says.
His confidence made sense. Uruguay — a country with universal health care, a robust epidemiological surveillance system and a relatively small population, of 3.5 million — has mostly evaded yellow fever, Zika and other infectious diseases that have plagued its neighbours.
But Moratorio understood the risk. “Gonzalo dashed out of the meeting and got to work,” says Batthyány. “When he’s convinced that something needs to be done, he knocks down mountains. He’s a Don Quixote in that way.”...
Imagine that, a country where people buy a scientist a beer for doing science...
Uruguay sounds like a civilized country, particularly when compared to a prominent North American country where a vast nuclear arsenal is put in the hands of a puerile insane person.
I excerpted another part of this fine article earlier: Chanda Prescod-Weinstein: A force in physics confronting racism in science.
Profile Information
Gender: MaleCurrent location: New Jersey
Member since: 2002
Number of posts: 33,598