Welcome to DU!
The truly grassroots left-of-center political community where regular people, not algorithms, drive the discussions and set the standards.
Join the community:
Create a free account
Support DU (and get rid of ads!):
Become a Star Member
Latest Breaking News
General Discussion
The DU Lounge
All Forums
Issue Forums
Culture Forums
Alliance Forums
Region Forums
Support Forums
Help & Search
Environment & Energy
Related: About this forumJames Hansen et al: Global Warming Acceleration: El Nino Measuring Stick Looks Good
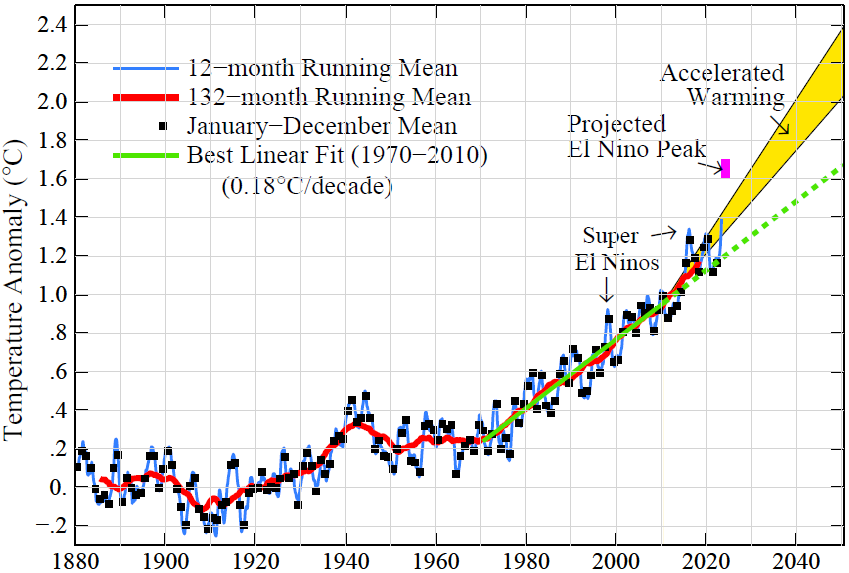
Fig. 1. Global temperature relative to 1880-1920 based on the GISS analysis.[1],[2]
Global Warming Acceleration: El Nino Measuring Stick Looks Good (PDF)
14 December 2023
James Hansen, Makiko Sato, Reto Ruedy
Abstract. Global warming is accelerating because the drive for warming, Earth’s energy imbalance, has doubled in the past decade. Measurement of the acceleration is hampered by unforced tropical (El Nino/La Nina) variability, but a good measuring stick is provided by warming between successive large El Ninos. Strengthening of the current (2023-24) El Nino has raised it to a level similar to the 1997-98 and 2015-16 El Ninos. The first six months of the current El Nino are 0.39°C warmer than the same six months of the 2015-16 El Nino, a global warming rate of 0.49°C/decade, consistent with expectation of a large acceleration of global warming. We expect the 12-month mean temperature by May 2024 to eliminate any doubt about global warming acceleration. Subsequent decline of the 12-month temperature below 1.5°C will likely be limited, confirming that the 1.5°C limit has already been passed.
Global temperature has increased 0.18°C/decade since 1970 (Fig. 1). Temperature prior to the current El Nino was ~1.2°C above the preindustrial level (taken to be the 1880-1920 average, the earliest period with reasonable global coverage of instrumental measurements). The goal of the United Nations Framework Convention on Climate Change[3] and the Paris Agreement[4] is for the rate of warming to slow down so that global warming stabilizes at a level of 1.5°C or less. We find,[5] on the contrary, that global warming post-2010 must be in an accelerated warming phase, based on a large increase in Earth’s energy imbalance, which is the immediate drive for global temperature change. We project an acceleration of the post-2010 warming rate by 50-100 percent (yellow area in Fig. 1). Thus, global temperature is now accelerating past 1.5°C and it could reach 2°C in the 2030s, barring purposeful actions to reduce or reverse Earth’s energy imbalance.
Acceleration of global warming has been hidden so far by the large natural variability of global temperature, especially because of the unusual 3-year period of strong La Ninas that ended this year. If we wait long enough, say another decade, the changed trend will be obvious, but we need to understand the situation sooner. We will argue elsewhere[6] that actions to cool the planet should be taken within less than a decade if we are to have a good chance of avoiding polar climate change amplifications that would be difficult, if not impossible, to reverse.
Fig. 2. Temperature in the tropical Pacific region used to define El Nino strength. El Nino (La Nina) is nominally defined to occur when Nino 3.4 is > 0.5°C (< –0.5°C).
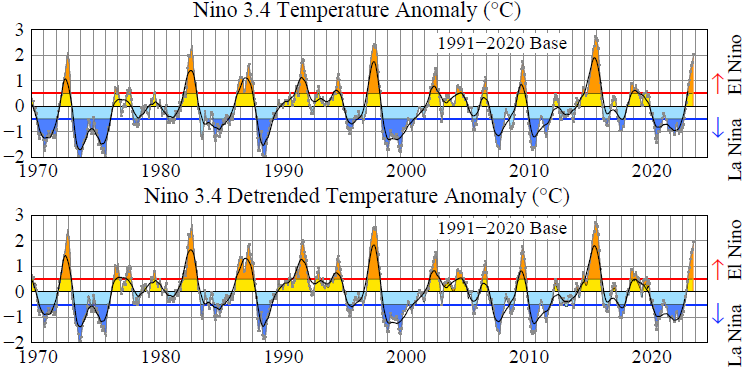
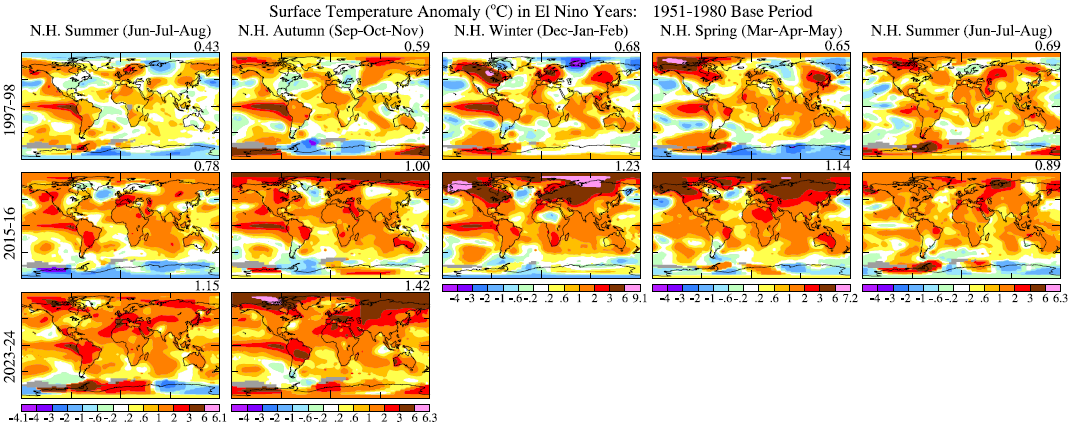
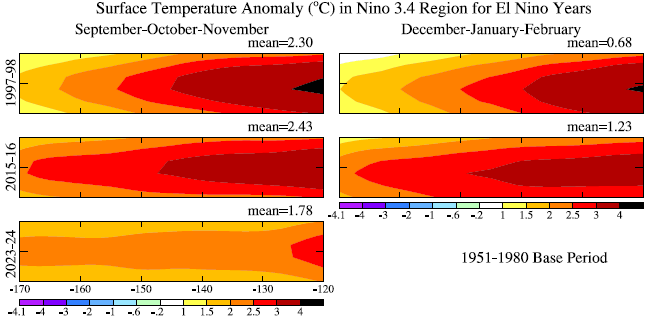
Thus, there is strong desire for earlier, more precise, quantification of global warming acceleration. A useful suggestion by Jeremy Grantham[7] is to check the warming rates between the peaks of successive strong El Ninos, which occur every decade or two. It now seems that the current El Nino will qualify. The usual measure of El Nino strength is the Nino3.4 index (average temperature of the tropical Pacific at longitudes between 170°W and 120°W within 5° latitude of the equator. The raw Nino3.4 index (top chart in Fig. 2) shows the 2015-16 El Nino as stronger than the 1997-98 El Nino, which seems implausible given that the 1997-98 El Nino was unusually strong, sometimes described as the strongest of the 20th century. Ubiquitous global warming surely adds to the Nino3.4 temperature and makes more recent El Ninos artificially strong, as measured by Nino3.4 temperature. The maps in Fig. 3 confirm this interpretation: the 1997-98 El Nino is the strongest of the three El Ninos, even though the maps include the growing global warming driven by increasing greenhouse gases (GHGs). Simple detrending of the Nino3.4 index (lower half of Fig. 2) does not fully remove this bias. A clear picture is provided by maps of the temperature anomalies for the Nino3.4 region (Fig. 4). The 1997-98 El Nino shows greatest warming, but the others are enhanced by background (GHG) warming that existed prior to the El Nino and covers the entire Nino3.4 region.
Fig. 3. Global temperature by season during growth and phasedown of the 3 large El Ninos.
Fig. 4. Surface temperature anomaly in Nino3.4 region during three major El Ninos.
…
InfoView thread info, including edit history
TrashPut this thread in your Trash Can (My DU » Trash Can)
BookmarkAdd this thread to your Bookmarks (My DU » Bookmarks)
1 replies, 1211 views
ShareGet links to this post and/or share on social media
AlertAlert this post for a rule violation
PowersThere are no powers you can use on this post
EditCannot edit other people's posts
ReplyReply to this post
EditCannot edit other people's posts
Rec (9)
ReplyReply to this post
1 replies
 = new reply since forum marked as read
Highlight:
NoneDon't highlight anything
5 newestHighlight 5 most recent replies
= new reply since forum marked as read
Highlight:
NoneDon't highlight anything
5 newestHighlight 5 most recent replies
= new reply since forum marked as read
Highlight:
NoneDon't highlight anything
5 newestHighlight 5 most recent replies
James Hansen et al: Global Warming Acceleration: El Nino Measuring Stick Looks Good (Original Post)
OKIsItJustMe
Dec 2023
OP

OKIsItJustMe
(19,938 posts)1. Figure 6
Fig. 6. Global temperature (relative to 1880-1920 mean for each month) for the 1997-98, 2015-16 and 2023-24 El Ninos. The impact of El Nino on global temperature usually peaks early in the year (the El Nino Peak Year) following the year in which the El Nino originated.
