Environment & Energy
Related: About this forumWeekly CO2 Concentrations at the Mauna Loa/Maunakea Observatory Above 420 ppm Again.
As I have noted in this space on a number of times before, for many years, I have been monitoring the weekly and monthly average CO2 concentrations at the Global Monitoring Laboratory for many years, entering data found on the data pages into spreadsheets for calculation purposes.
In general, as the following graphic shows, over a year, these concentrations are generally sinusoidal in nature, represented by a composite function by superimposition on a roughly quadratic axis despite the inherent noisiness of the localized data.

I derived a crude equation for the quadratic using very simple calculus here: A Commentary on Failure, Delusion and Faith: Danish Data on Big Wind Turbines and Their Lifetimes.
... This admittedly crude "model" roughly suggests that the concentration of dangerous fossil fuel waste, carbon dioxide concentrations, given the trend, will be around 520 ppm “by 2050,” in 28 years, passing, by solving the resultant quadratic equation, somewhere around 500 ppm around 2046, just 24 years from now.
I’ll be dead then, but while I’m living the realization of what we are doing to future humanity fills me with existential horror...
The current winter seems to suggest that the general trends I suggested are not holding; recent increases both on the year to year monthly and weekly data for much of 2022 and 2023 have been relatively mild. In 2019, the average weekly reading compared to the same week of 2018 was 2.90 ppm higher; in 2020, the average reading was 2.58 ppm higher. In the times of peak Covid, 2021 and 2022, it fell respectively to 2.18 and 2.12 ppm.
In 2023, for the first five weeks of the year, it is running at 1.28 ppm over 2022.
There are several possible reasons for this. One, of course, is that despite my repeated criticism of what I regard as a wasteful fantasy, that a so called "renewable energy" nirvana has at last broken out. I doubt it.
The "renewable energy" nirvana in Germany has amounted to funding Vladimir Putin's coffers by replacing nuclear with gas energy, and when embarrassed into being less cushy with Putin, gas with coal.
As of this writing, 3:18 pm EST (US), 19:18 Berlin time, Feb. 12, 2023, the German electric grid is powered largely by coal. It's 61.4 "Gigawatts" of wind capacity is actually running at an instantaneous power of 6.01 GW, 9.12% of capacity utilization.

The carbon intensity of German electricity is an appalling 674 g CO2/kwh, which in "percent talk" is 624% higher than France's 108 g CO2/kwh, despite Hollande's and Macron's deference of maintenance of the once magnificent French infrastructure in hopes of drinking some German Koolaid. (Macron has reversed this policy in his second term, in the category of "too little; too late.)
A more probable cause of the recent mild increases in carbon dioxide increases thus far in this winter has been relatively warm weather in Europe, and the American Northeast, some polar vortexes notwithstanding. We have had here in New Jersey where I live on every light patina of snow sticking all winter up to now. Internationally this may have overwhelmed the German need to switch from gas to coal.
My house is heated with dangerous natural gas; the waste of which is dumped directly into the planetary atmosphere. My wife - who handles our finances informed me that this winter's gas bill is about half of what it was last year.
It's February. In my ten day forecast the temperatures will fall below freezing (briefly) for only two days.
Another possibility is a systematic error. The observatory at Mauna Loa was closed by lava flows from the Mauna Loa volcano on November 29, and the measurements are now being taken at the University of Hawaii at Mauna Kea. There may be some unknown difference in the instruments or data collection procedure, perhaps with respect to addressing background. This I think is unlikely.
It may be statistical noise.
Last year's peak concentrations were recorded during the week beginning May 29, 2022, at 421.63 ppm. By the week beginning July 3, 2022, it had fallen below 420 ppm (419.73 ppm). A local minimum was reached during the week beginning October 2, 2022, 415.27 ppm.
We are now once again above 420 ppm.
Week beginning on February 05, 2023: 420.26 ppm
Weekly value from 1 year ago: 418.57 ppm
Weekly value from 10 years ago: 396.84 ppm
Last updated: February 12, 2023
Weekly average CO2 at Mauna Loa (Accessed Feb 12, 2023.)
This week, yesterday, we saw the first daily reading above 421 ppm.
February 11: 421.15 ppm
February 10: 420.33 ppm
February 09: 420.24 ppm
February 08: 420.12 ppm
February 07: 419.55 ppm
Last Updated: February 12, 2023
Recent Daily Average Mauna Loa CO2
Despite some locally strange data in the last few weeks, nothing about this situation is particularly pretty.
Have a pleasant work week. If you're involved in this Superbowl thing, have fun.
 = new reply since forum marked as read
Highlight:
NoneDon't highlight anything
5 newestHighlight 5 most recent replies
= new reply since forum marked as read
Highlight:
NoneDon't highlight anything
5 newestHighlight 5 most recent replies

jpak
(41,763 posts)Yup

When my son went to the accepted students forum for the Ph.D nuclear engineering program he ultimately joined, the faculty member leading one of the sessions asked the students being recruited how many of them were there because of climate change.
Three quarters of the prospective students raised their hand. They were all brilliant people in that room.
My generation; with a large coterie of sloganeering, sneering, cursing, chanting, indifferent, bourgeois malcontents; has left their generation with an intractable climate problem driven, for example, as shown in the graphic above in the OP, by the German fear and ignorance, by treating climate change as a trivial joke.
The Germans are actively killing people with this decision to shut nuclear plants and replace them with fossil fuels:
Anil Markandya, Paul Wilkinson, Electricity generation and health, The Lancet, Volume 370, Issue 9591, 2007, Pages 979-990.
Here's table 2: 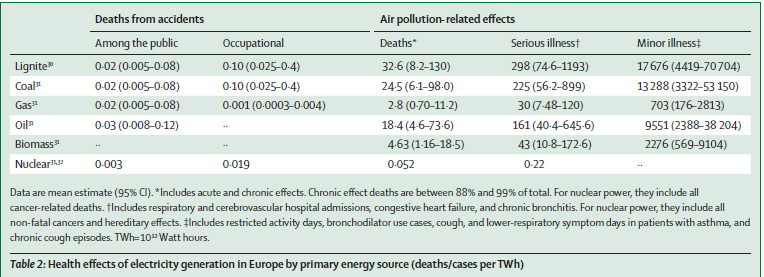
All of humanity, all living things will pay the price for the elevation of ignorance above rational sense.
I often see giggling here with respect to climate change. I find it disgusting, but that's just me. I have had to live with this disgust for many years. I'm used to it.
Eighteen thousand people will die today because of anti-nuke cults and their blithe, immoral tolerance of air pollution.
Global burden of 87 risk factors in 204 countries and territories, 1990–2019: a systematic analysis for the Global Burden of Disease Study 2019 (Lancet Volume 396, Issue 10258, 17–23 October 2020, Pages 1223-1249)
Some of us have the moral depth to give a shit about those people; others of us clearly don't.
The nuclear engineering Ph.D. students in my son's laboratory, and the other laboratories in his department and the associated National Laboratory really don't give a fuck about tired sneering from old people who clearly don't give a shit about the future of humanity nor about the planet. It's clear that these sneering old people have very little to say that even remotely matters on the scale of the tragedy before us.
They have work to do, and no time for clowns.
Have a wonderful week.