General Discussion
Related: Editorials & Other Articles, Issue Forums, Alliance Forums, Region ForumsKrugman on Kudlow ...
Link to tweet
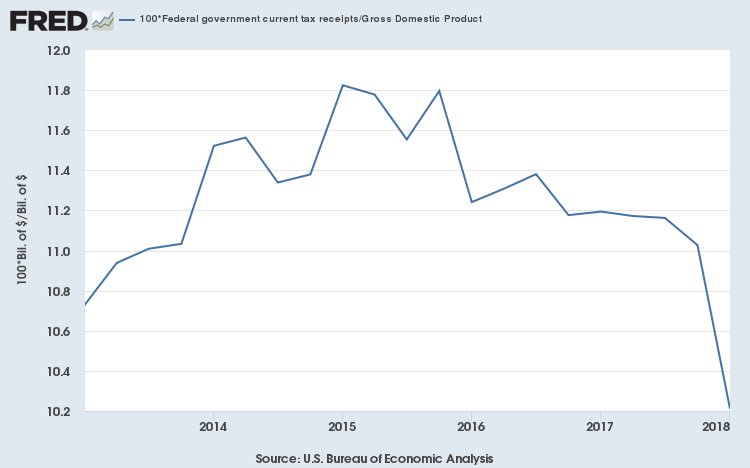
As always, facts have a well-known anti-Trump bias.Below, revenue as % of GDP, falling off a cliff. Is the administration's top economic official ignorant or lying? Does it matter? 2/
 = new reply since forum marked as read
Highlight:
NoneDon't highlight anything
5 newestHighlight 5 most recent replies
= new reply since forum marked as read
Highlight:
NoneDon't highlight anything
5 newestHighlight 5 most recent replies
Hoyt
(54,770 posts)
WhiteTara
(29,771 posts)you say very stupid things. Not to mention the stroke factor.

BSdetect
(9,008 posts)
pansypoo53219
(21,057 posts)Jim Lane
(11,175 posts)He shows only that revenues expressed as a percentage of GDP are falling.
The supply-side argument is that lower tax rates will reduce revenues as a percentage of GDP, but will also stimulate enormous gains in economic activity. As a result, revenues will be a smaller share of a larger pie, so that the actual amount of government revenues will be higher even as the percentage is lower.
I agree with him that, historically, it hasn't happened. To show it, however, he needs to present data on gross revenues, not as a share of GDP.

Lucky Luciano
(11,277 posts)...namely 100% is definitely the case as there is no reason to work at all so no revenues for the government unless the taxes are lowered. It is definitely false when taxes are 0% because raising taxes clearly increases revenues from there. Somewhere in the middle is the optimal tax rate for government revenues. Republicans think that rate is close to 0% which is stupid.
I don’t know where that optimal tax rate is.

progree
(10,990 posts)This has the graph. Last observation: 2018 Q1 2038.234 $billions
https://fred.stlouisfed.org/series/W006RC1Q027SBEA
Sorry I don't know how to embed FRED graphs without going through a lot of gymnastics of taking a screen shot and saving as a .jpg or .png or whatever and uploading to my Imgur account and all that.
And the data, of which the last few quarters are shown below. In $billions.
https://fred.stlouisfed.org/data/W006RC1Q027SBEA.txt
2016-01-01 2060.060 Billion dollars
2016-04-01 2096.292
2016-07-01 2131.564
2016-10-01 2112.996
2017-01-01 2133.378
2017-04-01 2150.665
2017-07-01 2176.787
2017-10-01 2178.271
2018-01-01 2038.234
The "2018-01-01 2038.234" is actually 2018 Q1 which BEGINS Jan 1 and ENDS March 31. So yup, the first 3 months of the tax cuts does not seem to be very helpful. 2018 Q1 federal revenues down 6.4% from the previous quarter, and down 4.5% from 2017's Q1.
The news today is that the final estimate of Q1 2018 GDP is a 2.0% annualized growth rate. Not stellar.
But supposedly Q2 is expected to be a lot better with some economists predicting a better than 5% annualized growth rate, supposedly mostly because of the tax cut. LOL.