Democratic Underground Latest Greatest Lobby Journals Search Options Help Login
Google

This month warmest on satellite record (so far):

Printer-friendly format Printer-friendly format
Printer-friendly format Email this thread to a friend
Printer-friendly format Bookmark this thread
This topic is archived.
Home » Discuss » Topic Forums » Environment/Energy Donate to DU
 
joshcryer Donating Member (1000+ posts) Send PM | Profile | Ignore Tue Feb-02-10 08:02 PM
Original message
This month warmest on satellite record (so far):
I am producing this post to keep track of UAH temperature trends (the satellite with the *lowest* overall temperature of them all, yet still showing this year to be the warmest on its record).

You can view the daily graph here: http://discover.itsc.uah.edu/amsutemps/

I'm posting Feb 1 here:


I will continue updating this every now and again, as the year goes by. Maybe once a week or two or once a month. I fully believe that 2010 will be the hottest year on record, and UAH is a satellite record commonly referenced by "skeptics" as "proof" that the world is cooling or that temperature trends are flat.

Printer Friendly | Permalink |  | Top
defendandprotect Donating Member (1000+ posts) Send PM | Profile | Ignore Tue Feb-02-10 09:37 PM
Response to Original message
1. This DECADE is the warmest ever -- !!!
Printer Friendly | Permalink |  | Top
 
joshcryer Donating Member (1000+ posts) Send PM | Profile | Ignore Wed Feb-03-10 01:07 AM
Response to Reply #1
2. Very true! But monthly trend are the deniers' crutch. If 2010 is undeniably...
...the hottest year ever going by the *coldest* temperature record, then what can they say? UAH is the deniers favorite temperature record of them all. They can't argue with it because it is run by a "skeptic" (Roy Spencer).
Printer Friendly | Permalink |  | Top
 
Nederland Donating Member (1000+ posts) Send PM | Profile | Ignore Sat Apr-03-10 12:05 AM
Response to Reply #2
36. Ummmm
Do you realize that "skeptics" don't deny that the world is warming?
Printer Friendly | Permalink |  | Top
 
joshcryer Donating Member (1000+ posts) Send PM | Profile | Ignore Sat Apr-03-10 06:29 AM
Response to Reply #36
37. BS, many of them "question" the warming.
And even those of them who "accept" the warming like to downplay it. However, 2010 is looking to be the hottest year on any record period. So. The deniers will try to spin it.
Printer Friendly | Permalink |  | Top
 
Nederland Donating Member (1000+ posts) Send PM | Profile | Ignore Sat Apr-03-10 10:46 AM
Response to Reply #37
40. Among honest people
...there is little debate about the temperature record. It is what it is, especially the satellite record.

No, the debate that exists concerns what caused the warming and what rate we can expect in the future. Unless you engage in blatant cherry picking, no observed trend indicates a warming of more than 1.6C per century. Will the rate of warming increase? Maybe. It all depends on how much faith you have in the computer models. When I see noisy plots like this one, I'm less than impressed:

Printer Friendly | Permalink |  | Top
 
joshcryer Donating Member (1000+ posts) Send PM | Profile | Ignore Sat Apr-03-10 09:18 PM
Response to Reply #40
42. There exist no credible reason for the cause other than AGW.
Those who are looking for "causes" are grasping at straws, and trying to downplay the effects.

With regards to 1.6 C, that assumes a very poor understanding of climate forcings and models. 3.0C per century is in the 95% likelihood. Yes, it most certainly can be 1.6C, but that is highly unlikely.

You can dismiss models, that's fine, you don't understand them nor could you possibly grasp them, but some of the models are open, and if anyone has a problem with them they are free to make their objections, assuming they are actually capable of understanding them. The newest models will have pretty good cloud forcings (the most disputed aspect of AGW models), and IPCC AR5 will discuss them at length.

Printer Friendly | Permalink |  | Top
 
Nederland Donating Member (1000+ posts) Send PM | Profile | Ignore Sun Apr-04-10 02:20 AM
Response to Reply #42
44. I agree
There exists no credible reason for the warming that has occurred other than AGW. What I do not believe is that the current rate will increase to 3.0C per century. The supposition that the rate will increase to 3.0 is based upon speculation regarding CO2 feedbacks that are at this point in time unproven (you can't prove them in a lab, all you can do is observe the way the planet responds to the current conditions and wait). I also think that you misunderstood my comments with regard to 1.6 C. I was referring to the observed record. That is why I said that unless you engage in blatant cherry picking, no trend line exists that exceeds 1.6 C. This is not a matter of opinion, it is a historical fact. Take a look at the temperature record yourself. Depending on what source you use, the 5 year trend is negative, the ten year trend is around 1.0, the twenty degree trend is around 1.6, the thirty year trend is around 1.5, the fifty year trend is around 1.3, the seventy year trend is around 0.9 and the hundred year trend is around 0.7. So, as I said, unless you blatantly cherry pick a period like 1988 to 1998, you can't find a period that exceeds 1.6 C.

An important point to understand regarding climate is that CO2 is not the only actor. You quote the party line when you say "there exists no credible reason for the cause other than AGW", and as I said, it is true. However, it is also true that you cannot explain the twentieth century temperature record changes with CO2 alone. Plot a graph of 20th century temperatures superimposed on a graph of 20th century CO2 levels. You'll see periods of temperature changes that cannot be explained by changes in CO2 levels, so obviously there are other forcings at work. Even if you include all the anthropogenic forcings, you still can't explain the full 20th century temperature record. Obviously therefore, the trends that we have observed over the last 100 years are a combination of natural and man-made forcings. It is the exact quantification of all the forcings that are at work that is very much unknown at this point. Hell, the different models all use different formulas, so to claim that climate sensitivity is "settled science" is ridiculous on its face.

Look at the graph I posted above. None of the individual models come even close to modeling reality. None. Sure, when you smooth out the graph by averaging all the models together you get something that looks vaguely like the historical record, but that is meaningless. The fact is that all the individual models are wrong, and if you think that you can possibly get a correct answer by averaging a bunch of wrong answers together you have a serious cognitive deficiency.

Finally, I have to make a point regarding a most curious statement you made. You said "the newest models will have pretty good cloud forcings". This is not a scientific statement, it is a statement of faith. It is a statement of faith because what makes a "good" model is the ability to predict future conditions. Since future conditions have by definition not happened yet, you cannot possibly have any evidence that the cloud forcings in the newest models are "pretty good". Let the models predict what the next ten years will look like, then wait ten years and compare the predictions to the observed record. Then and only then will you be able to say whether or not the new cloud forcings are "pretty good". Right now you simply cannot know.
Printer Friendly | Permalink |  | Top
 
joshcryer Donating Member (1000+ posts) Send PM | Profile | Ignore Sun Apr-04-10 08:44 AM
Response to Reply #44
47. I've read the papers on the cloud models, I find nothing particularly bad about them.
Therefore they're "pretty good." This is not an "article of faith" so much optimism that they'll be done with their models in time for AR5.

The rest of what you say, I don't know what to say. You fail to realize that AGW was *not detectable* from background noise until 15 years ago.

The 20th century temperature variance is explained by various reasons, for one, the early industrial pollution which caused a haze caused a lot of cooling where temperatures were being measured. In any case, this is why I am looking at the satellite record. We have more than a decade of satellite data, in fact, satellite data throughout the whole period in which AGW was detectable from background noise.
Printer Friendly | Permalink |  | Top
 
Nederland Donating Member (1000+ posts) Send PM | Profile | Ignore Sun Apr-04-10 11:46 PM
Response to Reply #47
49. Interesting
Your definition of whether or not a model is "good" or not does not involve whether or not the model predicts reality accurately.

Unbelievable.
Printer Friendly | Permalink |  | Top
 
joshcryer Donating Member (1000+ posts) Send PM | Profile | Ignore Mon Apr-05-10 12:13 AM
Response to Reply #49
50. Nonsense.
You're making crap up.
Printer Friendly | Permalink |  | Top
 
Nederland Donating Member (1000+ posts) Send PM | Profile | Ignore Mon Apr-05-10 12:26 AM
Response to Reply #50
53. Am I?
Edited on Mon Apr-05-10 12:26 AM by Nederland
Post #47: I've read the papers on the cloud models, I find nothing particularly bad about them. Therefore they're "pretty good."

Am I missing a reference to comparing model predictions to reality in those two sentences?
Printer Friendly | Permalink |  | Top
 
joshcryer Donating Member (1000+ posts) Send PM | Profile | Ignore Mon Apr-05-10 12:30 AM
Response to Reply #53
54. Their job is to project, I have no problem with their job.
The new cloud models are quite impressive.
Printer Friendly | Permalink |  | Top
 
Nederland Donating Member (1000+ posts) Send PM | Profile | Ignore Mon Apr-05-10 12:47 AM
Response to Reply #54
57. What makes them impressive?
Their accuracy? No, it can't be that, because not enough time has past to make a judgment. So I'm curious, what makes them impressive? The number of lines of code it takes to implement them? The complexity of the math? What exactly is it that impresses you?
Printer Friendly | Permalink |  | Top
 
joshcryer Donating Member (1000+ posts) Send PM | Profile | Ignore Mon Apr-05-10 12:50 AM
Response to Reply #57
59. The fact that they model clouds explicitly?
It's not parameterization as was done in the past.
Printer Friendly | Permalink |  | Top
 
Nederland Donating Member (1000+ posts) Send PM | Profile | Ignore Mon Apr-05-10 01:24 AM
Response to Reply #59
60. I'm sure they do model clouds explicitly
The question is, do you think it's important to know whether or not they do it, you know, correctly?
Printer Friendly | Permalink |  | Top
 
joshcryer Donating Member (1000+ posts) Send PM | Profile | Ignore Mon Apr-05-10 02:59 AM
Response to Reply #60
62. I think it's important to know whether or not they make the best efforts that they can.
Moving from parameterization to explicit modeling is a huge leap dude.
Printer Friendly | Permalink |  | Top
 
Nederland Donating Member (1000+ posts) Send PM | Profile | Ignore Mon Apr-05-10 03:50 AM
Response to Reply #62
65. And is that the only thing that's important?
Edited on Mon Apr-05-10 03:54 AM by Nederland
That they "make the best efforts that they can"? Is the accuracy of their efforts irrelevant?

Here is the difference between you and me. You look at the efforts of modeling clouds NOW and say you're impressed. I think it's more important to wait and see if they are accurate before passing judgment. If in ten years the cloud modeling turns out to be accurate, THEN I'll be impressed. I don't give a shit if they made their "best effort" or not. I want their effort to result in an accurate model, because THAT is what's important--getting an accurate model.
Printer Friendly | Permalink |  | Top
 
joshcryer Donating Member (1000+ posts) Send PM | Profile | Ignore Mon Apr-05-10 07:06 PM
Response to Reply #65
66. The models *are* accurate, they're just imperfect.
The new models will *not* be too divergent from the old models, as explicit modeling follows the parameterized models quite nicely. (Proving that the parameterization they used, btw, wasn't just a made up hack, but based on observation.)
Printer Friendly | Permalink |  | Top
 
Nederland Donating Member (1000+ posts) Send PM | Profile | Ignore Tue Apr-06-10 09:38 AM
Response to Reply #66
68. How do you know?
Edited on Tue Apr-06-10 10:08 AM by Nederland
The models cited in AR4 did their runs in 2006, so you only have ~3 1/2 years of data to look at. Is it your contention that 3 1/2 years is sufficient time to declare a model accurate enough to predict the next 100?
Printer Friendly | Permalink |  | Top
 
DrGregory Donating Member (427 posts) Send PM | Profile | Ignore Sun Oct-03-10 11:19 AM
Response to Reply #62
144. Explicity model in a whole Earth simulation?
Moving from parameterization to explicit modeling is a huge leap dude.
========================================================

Are you saying that explicit models are used for whole Earth
simulations?

I find that hard to believe. Clouds, their formation and transport
properties, are affected by physics at the level of molecular diffusion.

Some of the physics important to clouds happens at very small length
scales. If one wants to do an explicit model, one has to resolve these
very small length scales. However, if one has a calculational mesh that
is so fine as to resolve these fine length scale phenomena; then one can't
extend that to a whole Earth simulation without blowing off the largest
most powerful computers on the planet.

Additionally, one has to remember that these are also chaotic systems; a
small error due to round-off error can have large effects. Most physics
calculations are done in 64-bit "double precision". Chaotic systems can
still be seeded with spurious error even at 64-bit resolution.

The transport theory problems with clouds are by no means "solved".

Dr. Greg


Printer Friendly | Permalink |  | Top
 
DrGregory Donating Member (427 posts) Send PM | Profile | Ignore Sun Oct-03-10 11:09 AM
Response to Reply #47
143. Not what I've heard / read
I've read the papers on the cloud models, I find nothing particularly bad about them.
====================================================================================

Transport theory - solution to the Boltzmann transport equation for
neutrons, photons, or charged particles is my specialty.

I've attended conferences on transport theory with climate modelers from
NCAR and universities, and that's not what I hear.

They say they still don't have a handle on the transport characteristics of
clouds. Clouds are fractal in nature - they behave as if their dimension
is not an integer.

Additionally, no computer is fast enough or has enough memory for the climate
modelers to model clouds without a LOT of ad hoc averaging. They have to use
meshes in which the mesh spacing is many miles - and a single mesh cell is
bigger than most clouds.

The climate modelers tell me that their models are "..not ready for prime time.."
and they were upset with other scientists that treated them as if their models
were a finished product and not a work in progress.

Dr. Greg
Printer Friendly | Permalink |  | Top
 
beardown Donating Member (193 posts) Send PM | Profile | Ignore Sat Apr-03-10 10:17 AM
Response to Reply #36
38. Maybe you hang with a better group of skeptics than I do.
I've frequently read skeptics posting about how things really aren't warmer or aren't warmer enough to be statistically significant or that it was warmer for a couple of years, but now it's cooling, etc. The common idea being that the Earth isn't warming up.

And I'm not even counting the legions of deniers that routinely post that because their freezer is cold today that there can't possibly be global warming. Okay, I made up the freezer part, but they do use their local temperature as their basis for making their decision on global warming.
Printer Friendly | Permalink |  | Top
 
joshcryer Donating Member (1000+ posts) Send PM | Profile | Ignore Sat Apr-03-10 09:21 PM
Response to Reply #38
43. The "minimalist" skeptics will cite "unknowns" and then magically decide it's a lower bound.
They can't make a case for the lower bound other than that there's some vast conspiracy that climate scientists are undertaking.

They love short term trends, and will cite them regularly to "prove" that the warming is a lower bound. And that's the delicious part, they claim it's a lower bound (less than 2.0C / century), but then have no problem citing stuff that implies there is no warming whatsoever, or even indicating a cooling trend (by pointing out weather trends).

It's absurd.
Printer Friendly | Permalink |  | Top
 
Nederland Donating Member (1000+ posts) Send PM | Profile | Ignore Sun Apr-04-10 02:34 AM
Response to Reply #43
45. You are the one who is absurd
Edited on Sun Apr-04-10 02:36 AM by Nederland
They love short term trends, and will cite them regularly to "prove" that the warming is a lower bound. And that's the delicious part, they claim it's a lower bound (less than 2.0C / century)

That is a complete lie. Go out and compute the following:

1) The current five year trend.
2) The current ten year trend.
3) The current twenty year trend.
4) The current thirty year trend.
5) The current fifty year trend.

Hell, pick any number of years you want. You won't find a single trend over 2.0C / century.
Printer Friendly | Permalink |  | Top
 
joshcryer Donating Member (1000+ posts) Send PM | Profile | Ignore Sun Apr-04-10 08:34 AM
Response to Reply #45
46. Uh, AGW has only been detectable from the noise for the last 15 fucking years.
Of course you're not going to find a century long trend in a 15 year cycle. What a joke. You're doing exactly what I said.
Printer Friendly | Permalink |  | Top
 
Nederland Donating Member (1000+ posts) Send PM | Profile | Ignore Sun Apr-04-10 05:08 PM
Response to Reply #46
48. I'm not asking about whether or not AGW is detectable
I'm asking you what the 5, 10, 20, 30, and 50 year temperature trend lines are. Are you saying those temperature trends are impossible to calculate?
Printer Friendly | Permalink |  | Top
 
joshcryer Donating Member (1000+ posts) Send PM | Profile | Ignore Mon Apr-05-10 12:15 AM
Response to Reply #48
51. You need a 30 year trend to be able to make a projection like that.
Edited on Mon Apr-05-10 12:17 AM by joshcryer
We have a 15 year trend at best. That's why we build models. This is what's so exciting about AGW. It's going to be verified one way or another.

here, read this: http://moregrumbinescience.blogspot.com/2009/01/results-on-deciding-trends.html

You have major error bars on short term trends. If I picked 1990-1998 I could "claim" that the earth was warming dramatically and that the end of the world was nigh. But I don't do that and climate scientists don't do that.
Printer Friendly | Permalink |  | Top
 
Nederland Donating Member (1000+ posts) Send PM | Profile | Ignore Mon Apr-05-10 12:36 AM
Response to Reply #51
55. I guess I wasn't clear
I'm talking about the PAST. What is the temperature trend for the PAST 5 years, PAST 10 years, PAST 20 years, etc.
Printer Friendly | Permalink |  | Top
 
joshcryer Donating Member (1000+ posts) Send PM | Profile | Ignore Mon Apr-05-10 12:50 AM
Response to Reply #55
58. It is relatively flat until the 90s.
Indeed it follows the suns output pretty remarkably up until then (which is often why deniers end that correlation in the 90s, because they diverge).
Printer Friendly | Permalink |  | Top
 
Nederland Donating Member (1000+ posts) Send PM | Profile | Ignore Mon Apr-05-10 01:38 AM
Response to Reply #58
61. Here is the data
Edited on Mon Apr-05-10 01:40 AM by Nederland


Now, in post #43, you said: "They love short term trends, and will cite them regularly to "prove" that the warming is a lower bound"

So I have to ask, what trend do think is most relevant? I would completely agree that there some skeptics that will pull out that negative 5 year trend and try to say it proves something. Let me say unequivocally that I think those people are idiots. However, what trend do you think is most relevant here? More importantly, why should I believe that current trend, which is currently less than 1.6C per century regardless of what trend length you choose, is going to suddenly rocket up to 3.0 C per century? Before answering, keep in mind that "the science" says that the impact of the first doubling of CO2 is larger than the second.

The only answer you can possibly give involves feedbacks, true?
Printer Friendly | Permalink |  | Top
 
joshcryer Donating Member (1000+ posts) Send PM | Profile | Ignore Mon Apr-05-10 03:10 AM
Response to Reply #61
63. Certainly not the last 5 years.
The last 5 years have not shown a cooling (they have shown no statistically significant warming), indeed, you cannot derive any statistical significance from the last 5 years.

So why would you chose it? I linked a paper showing how bad the error bars are on data so old.

Note, that graph is also quite misleading visually. The 100 year trend actually has a temperature of .5 C / century while the 20 year trend has a value of .4 C / 20 years. Completely unexpected result given how the graph is laid out.

In any case, we are still within 15 years of a point where AGW is actually detectable. Why you insist on using trends to extrapolate is beyond me. They're not reliable enough. Yet.
Printer Friendly | Permalink |  | Top
 
Nederland Donating Member (1000+ posts) Send PM | Profile | Ignore Mon Apr-05-10 03:47 AM
Response to Reply #63
64. Incorrect
The twenty year trend is around 1.6C per century, not 0.4C. These numbers are calculated by observing the slope of the linear regression line through the data points. The starting data point is 02/1910, 02/1940, 02/1960, etc. The ending data point is always 02/2010.

Printer Friendly | Permalink |  | Top
 
joshcryer Donating Member (1000+ posts) Send PM | Profile | Ignore Mon Apr-05-10 07:08 PM
Response to Reply #64
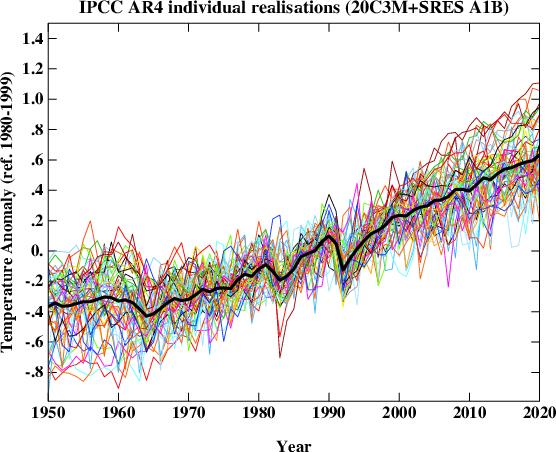
67. So that graph is taking a 20 year trend and extrapolating it by 100?
Do you even know how extrapolation is done? It's even more hilarious, taking a 5 year trend and extrapolating it by 100. Why not take the 1993-1998 trend and extrapolate it by 100.

Nonsense.
Printer Friendly | Permalink |  | Top
 
Nederland Donating Member (1000+ posts) Send PM | Profile | Ignore Tue Apr-06-10 09:44 AM
Response to Reply #67
69. No
The point of the graph is to demonstrate that predictions of 3.0 C per century are way out of line with observed conditions. If going from ~280ppm to ~360ppm gave you a temperature rise of only 1.0C, why would you believe that adding another 100ppm would give you 3.0C, especially given that the science says the first 100ppm rise has a greater effect than the second 100ppm rise?

They only possible answer is feedbacks.
Printer Friendly | Permalink |  | Top
 
joshcryer Donating Member (1000+ posts) Send PM | Profile | Ignore Mon Apr-05-10 12:20 AM
Response to Reply #48
52. And something your 1.6C / century claim is neglecting is the fact that CO2 is increasing.
So whatever you're basing it on it's made up and doesn't correlate with the increase of the greenhouse gas.
Printer Friendly | Permalink |  | Top
 
Nederland Donating Member (1000+ posts) Send PM | Profile | Ignore Mon Apr-05-10 12:40 AM
Response to Reply #52
56. Yes, CO2 is increasing
Edited on Mon Apr-05-10 12:43 AM by Nederland
But when you consider direct effects, the first 100 ppm increase has a larger effect than the second 100 ppm increase. This means that the only way you can get to a 3.0 / per century rise is to make assumptions about feedbacks. The magnitude of CO2 feedback is not something you can prove in a lab, so the accuracy of any number you come up with will always be debatable. That's why all the computer models use different feedback formulas--the "correct" formula is still a matter of opinion at this point.
Printer Friendly | Permalink |  | Top
 
kristopher Donating Member (1000+ posts) Send PM | Profile | Ignore Sat Oct-23-10 01:58 PM
Response to Reply #36
151. Want to pick on somebody bigger than you?
Edited on Sat Oct-23-10 01:58 PM by kristopher
Josh is an obviously inept at supporting his stance on AGW; but I'm not.

Care to try the same slimy bullshit on me?

Printer Friendly | Permalink |  | Top
 
Bigmack Donating Member (1000+ posts) Send PM | Profile | Ignore Wed Feb-03-10 12:43 PM
Response to Original message
3. Surely to god, you're
NOT living in the cruel illusion that reason, facts or logic will affect the thinking - opinions - of those willfully ignorant buffoons? Ms Bigmack
Printer Friendly | Permalink |  | Top
 
joshcryer Donating Member (1000+ posts) Send PM | Profile | Ignore Wed Feb-03-10 01:08 PM
Response to Reply #3
4. Not at all! It's for my own amusement.
To be able to reference this thread at the end of the year should be priceless. They'll even reference this post to indicate something nefarious. "He doesn't really want to prove his point!"

The point is proved morons!
Printer Friendly | Permalink |  | Top
 
pscot Donating Member (1000+ posts) Send PM | Profile | Ignore Wed Feb-03-10 05:16 PM
Response to Reply #4
5. If a tree falls in the forest
and someone is goimg LaLaLaLaLa, does it make a noise? I think not.
Printer Friendly | Permalink |  | Top
 
joshcryer Donating Member (1000+ posts) Send PM | Profile | Ignore Mon Feb-08-10 11:32 PM
Response to Original message
6. Feb 7th makes this month still warmest on record:
Printer Friendly | Permalink |  | Top
 
joshcryer Donating Member (1000+ posts) Send PM | Profile | Ignore Tue Feb-16-10 03:49 AM
Response to Original message
7. Feb 14th makes this month still warmest on record (despite record snows):
Printer Friendly | Permalink |  | Top
 
joshcryer Donating Member (1000+ posts) Send PM | Profile | Ignore Mon Feb-22-10 07:57 PM
Response to Original message
8. Feb 21st makes this month still warmest on record:
Printer Friendly | Permalink |  | Top
 
joshcryer Donating Member (1000+ posts) Send PM | Profile | Ignore Mon Mar-01-10 08:17 PM
Response to Original message
9. Feb. hottest month on satellite record.
February was the hottest month on the satellite record.

Printer Friendly | Permalink |  | Top
 
Dead_Parrot Donating Member (1000+ posts) Send PM | Profile | Ignore Mon Mar-01-10 09:57 PM
Response to Reply #9
10. But... TEH SNOW!
Printer Friendly | Permalink |  | Top
 
joshcryer Donating Member (1000+ posts) Send PM | Profile | Ignore Mon Mar-01-10 11:53 PM
Response to Reply #10
11. Funny part? UAH doesn't measure high latitude temperatures.
Higher latitudes have been historically way above normal. I find it likely that their extrapolation software is under reporting.
Printer Friendly | Permalink |  | Top
 
joshcryer Donating Member (1000+ posts) Send PM | Profile | Ignore Thu Mar-04-10 01:56 AM
Response to Original message
12. March 2nd makes this warmest month on record:


Forgot to update March 1st.
Printer Friendly | Permalink |  | Top
 
joshcryer Donating Member (1000+ posts) Send PM | Profile | Ignore Tue Mar-09-10 03:12 AM
Response to Original message
13. March 7th makes this warmest month on record:
The continued divergence is striking, one would have expected it to start following a tighter trend.


I am actually quite surprised that the trend is breaking all records.
Printer Friendly | Permalink |  | Top
 
n2doc Donating Member (1000+ posts) Send PM | Profile | Ignore Tue Mar-09-10 10:56 AM
Response to Reply #13
14. If it's still up there in late April we are really screwed n/t
Printer Friendly | Permalink |  | Top
 
guardian Donating Member (1000+ posts) Send PM | Profile | Ignore Tue Mar-09-10 12:39 PM
Response to Reply #14
15. "we are really screwed"
Yes I see what you mean. After all the Crocus might bloom 1/2 day early. Or God forbid the horror of--dare I say it--early tomatoes! DOOM DOOM DOOM

When is Hale-Bopp returning?
Printer Friendly | Permalink |  | Top
 
kestrel91316 Donating Member (1000+ posts) Send PM | Profile | Ignore Tue Mar-09-10 01:44 PM
Response to Reply #15
16. Here in SoCal I finally reached the point where I gave up altogether
on my garden. The tomatoes and peppers seared and melted on the vine just as they reached the time of year when they ripen. Planting earlier just meant MORE tomatoes melted and BIGGER plants died. I couldn't get my corn grown and pollinating in time to beat the blast furnace either.

I gardened here 15 years straight and saw things go to hell in that time.

You go ahead and laugh. I hope you know how to grow your own food when the farmers all fail. And while you are at it, read up on biodiversity and ecosystem collapse and how they are inextricably linked now to climate disruption.
Printer Friendly | Permalink |  | Top
 
joshcryer Donating Member (1000+ posts) Send PM | Profile | Ignore Tue Mar-09-10 03:45 PM
Response to Reply #15
17. If this trend continues then obviously the models were validated.
Edited on Tue Mar-09-10 03:46 PM by joshcryer
Tamino among others pointed this out, predicting this well in advance. There was even money being placed on whether or not there would be a new temperature record. We'll see if it came sooner rather than later.
Printer Friendly | Permalink |  | Top
 
NickB79 Donating Member (1000+ posts) Send PM | Profile | Ignore Tue Mar-09-10 04:27 PM
Response to Reply #17
18. And if the models are validated, then all the really bad predictions about AGW can't be ignored
And as I recall, those predictions focused mainly on wild weather extremes, droughts, crop failures, famine, rising sea levels, massive species extinction, etc.

But we might have early tomatoes, so that's all ok!
Printer Friendly | Permalink |  | Top
 
guardian Donating Member (1000+ posts) Send PM | Profile | Ignore Tue Mar-09-10 04:44 PM
Response to Reply #18
19. Surely the end times are at hand.
"predictions focused mainly on wild weather extremes, droughts, crop failures, famine, rising sea levels, massive species extinction, etc."


Not much difference between the doomer rhetoric and this


And I beheld when he had opened the sixth seal, and, lo, there was a great earthquake; and the sun became black as sackcloth of hair, and the moon became as blood;
And the stars of heaven fell unto the earth, even as a fig tree casteth her untimely figs, when she is shaken of a mighty wind.
Printer Friendly | Permalink |  | Top
 
joshcryer Donating Member (1000+ posts) Send PM | Profile | Ignore Tue Mar-09-10 05:19 PM
Response to Reply #19
20. The worst predictions are "only" 3.0C.
The worst predictions are "only" 1-2 meters of sea level rise by the end of the century.

The worst predictions are "only" crop movement to more northern latitudes.

The worst predictions are "only" displacing billions of people over a long period of time.

Climate change for a massive civilization, is not a problem, especially for wealthy countries. And the wealthy countries are not going to do shit about it. So I don't know what the problem is.

We're right. You're wrong. We saw it coming. Countries did nothing about it. Big whoop.
Printer Friendly | Permalink |  | Top
 
guardian Donating Member (1000+ posts) Send PM | Profile | Ignore Tue Mar-09-10 06:38 PM
Response to Reply #20
21. Big whoop is right
Edited on Tue Mar-09-10 06:38 PM by guardian
"The worst predictions are "only" 1-2 meters of sea level rise by the end of the century."

And of course as kool-aid drinking doomer you cite ONLY the worst predictions. Not the average, or median, and certainly not the best case. You don't even cite IPCC4 which had a worst case sea level rise of 580mm, which is 3x lower than your doomer nightmare.

Even if the "worst predictions" come true this is still within natural cycles for sea level changes. Sea levels vary all the time, and the rate of change varies all the time. Look at the curve on this graph and you'll see the slope was much higher in the past.


http://www.giss.nasa.gov/research/briefs/gornitz_09/


"We saw it coming." This is the only thing you saw coming

Printer Friendly | Permalink |  | Top
 
joshcryer Donating Member (1000+ posts) Send PM | Profile | Ignore Tue Mar-09-10 07:23 PM
Response to Reply #21
22. What? You were the one saying the apocalypse was coming.
The worst case scenario is no where near an apocalypse, it's uncomfortable for civilization, but it is by no means an end of the world scenario. You were purposefully exaggerating "amarmist" claims because it's an easy way to try to minimize the real science behind AGW.


This is the kind of tactics you and other deniers like to utilize:


Now, as far as AR4 sea level rise predictions, and before I explain this to you, I know fully that you are completely aware of it, but you're a denier so you pretend to be ignorant;

IPCC AR4 does not consider dynamical ice flow in its sea level rise predictions. ie, it only includes thermal expansion of the oceans, and glacial melt. It does not include Greenland melt, it does not include Antarctic melt.

I gave you "worst case scenarios" to illustrate that, uh, there is no apocalypse, it's just not a very pretty picture.

Just fyi, the best estimates, so far, are about .8 meters by the end of the century. 1-2 meters is absolute worst case.
Printer Friendly | Permalink |  | Top
 
The Croquist Donating Member (1000+ posts) Send PM | Profile | Ignore Tue Mar-09-10 08:27 PM
Response to Reply #21
23. 1 - 2 meters is a boatload but it is currently rising by about a foot (31 cm)
per century and that is about half what it has AVERAGED over the last 18,000 - 20,000 years. The thing that bothers me the most however is range of their predictions.

Last month there was a retraction in Nature of a prediction that sea-level would rise between "7 and 82 cm of sea-level rise by the end of the twenty-first century, respectively.". Now, after discovering an error, they say "Thus we no longer have confidence in our projections for the twentieth and twenty-first centuries, and for this reason the authors retract the results pertaining to sea-level rise after 1900." Fair enough but what kind of an estimate is 7 - 82 cm in the first place? Thats like saying the stock market will either be higher or lower at the end of the year then now.
Printer Friendly | Permalink |  | Top
 
beardown Donating Member (193 posts) Send PM | Profile | Ignore Sat Apr-03-10 10:35 AM
Response to Reply #23
39. Four things.
Assuming that you live in a place that has cold winters, when winter approaches do you get the tire chains out, cover up the outside faucets, and get out the winter coats or do you merely state that the current winter's temperature will fall within averages of the last 18,000 to 20,000 years and go driving out with 40 weight oil and a short sleeve T shirt on? I'm assuming that you prepare for winter. If we've seen large swings BEFORE the large scale use of fossil fuels then maybe we shouldn't just blinding ignore the possible effects of the CO2 on making those 18-20K swings even worse.

It's tough to be exact about a science that takes decades to observe and involves billions of variables, but the science is getting better and better all the time and it's being proven reasonably correct much of the time and when they find mistakes there have been open adjustments of the findings. Given how completely wrong the skeptics have been about so many issues they are in a poor position to complain about the accuracy of the consensus of climate science.

The ocean level will not rise the same level all across the globe. Some will rise more and some less as part of the average. As the old saying goes, you can drown in a river that only averages being one foot deep.

Finally, 18-20K years ago, how many millions/billions of humans were living in large cities or dependent on food production from coastal areas the last time that the ocean levels rose? Maybe by halving the human increase on the 'normal' ocean level rise might make the difference between 20 million displaced people and 5 million displaced people.
Printer Friendly | Permalink |  | Top
 
joshcryer Donating Member (1000+ posts) Send PM | Profile | Ignore Mon Mar-15-10 11:31 PM
Response to Reply #13
24. delete
Edited on Mon Mar-15-10 11:32 PM by joshcryer
dupe
Printer Friendly | Permalink |  | Top
 
joshcryer Donating Member (1000+ posts) Send PM | Profile | Ignore Mon Mar-15-10 11:32 PM
Response to Original message
25. March 14th makes this warmest month on record (wow):
Printer Friendly | Permalink |  | Top
 
Systematic Chaos Donating Member (1000+ posts) Send PM | Profile | Ignore Tue Mar-16-10 04:07 PM
Response to Reply #25
26. Wow, this really ought to be an interesting summer,
if your definition of "interesting" includes many thousands of deaths in heatwaves all over the northern hemisphere.

:(
Printer Friendly | Permalink |  | Top
 
joshcryer Donating Member (1000+ posts) Send PM | Profile | Ignore Tue Mar-16-10 05:04 PM
Response to Reply #26
27. Yep, we can look forward to at least a thousand deaths in, say, Chicago and throughout EU.
I bet the denialists won't say shit about our up and coming hot fucking summer.
Printer Friendly | Permalink |  | Top
 
guardian Donating Member (1000+ posts) Send PM | Profile | Ignore Sun Jun-13-10 02:35 PM
Response to Reply #27
102. 56F high in Boulder today
Printer Friendly | Permalink |  | Top
 
joshcryer Donating Member (1000+ posts) Send PM | Profile | Ignore Mon Jun-14-10 01:51 AM
Response to Reply #102
103. Fuck off.
Wait a few days, weather watcher. Oh I guess you forgot about last week already (hint, I live in Colorado).
Printer Friendly | Permalink |  | Top
 
joshcryer Donating Member (1000+ posts) Send PM | Profile | Ignore Tue Mar-23-10 12:44 AM
Response to Original message
28. March 21st makes this warmest month on record (but it's cooling!)
We're clearly entering a little ice age!

Printer Friendly | Permalink |  | Top
 
Systematic Chaos Donating Member (1000+ posts) Send PM | Profile | Ignore Tue Mar-23-10 09:51 AM
Response to Reply #28
29. I won't be happy until that orange line goes as low or lower than the hot pink line...
...and stays there for the entire goddamn summer.
Printer Friendly | Permalink |  | Top
 
Viking12 Donating Member (1000+ posts) Send PM | Profile | Ignore Tue Mar-23-10 10:06 AM
Response to Reply #28
30. FYI:
Only the latter half of 1998 is represented in that graph.
Printer Friendly | Permalink |  | Top
 
joshcryer Donating Member (1000+ posts) Send PM | Profile | Ignore Tue Mar-23-10 10:31 PM
Response to Reply #30
31. Yes but the overall trend cannot deviate much from the average.
Even though it's cooling a bit now because of the cold snap, it will move back above the rest of the lines afterward.
Printer Friendly | Permalink |  | Top
 
joshcryer Donating Member (1000+ posts) Send PM | Profile | Ignore Mon Mar-29-10 05:23 AM
Response to Original message
32. March 27th makes this warmest month on record (slight uptick).
On average March was the warmest March on record. On to April.

Printer Friendly | Permalink |  | Top
 
joshcryer Donating Member (1000+ posts) Send PM | Profile | Ignore Fri Apr-02-10 02:19 PM
Response to Original message
33. March was warmest month on satellite record:
Printer Friendly | Permalink |  | Top
 
Systematic Chaos Donating Member (1000+ posts) Send PM | Profile | Ignore Fri Apr-02-10 05:29 PM
Response to Reply #33
34. March, 2010 is to the rest of the satellite record...
...as Stage IV colon cancer is to mild indigestion.

:banghead:
Printer Friendly | Permalink |  | Top
 
joshcryer Donating Member (1000+ posts) Send PM | Profile | Ignore Fri Apr-02-10 06:56 PM
Response to Reply #34
35. Pretty much. This is going to be a tough year.
Printer Friendly | Permalink |  | Top
 
joshcryer Donating Member (1000+ posts) Send PM | Profile | Ignore Sat Apr-03-10 11:26 AM
Response to Original message
41. April 1st makes this warmest month on record:
Printer Friendly | Permalink |  | Top
 
joshcryer Donating Member (1000+ posts) Send PM | Profile | Ignore Thu Apr-08-10 09:47 PM
Response to Original message
70. April 7th makes this warmest month on record:
Printer Friendly | Permalink |  | Top
 
NickB79 Donating Member (1000+ posts) Send PM | Profile | Ignore Thu Apr-08-10 10:32 PM
Response to Reply #70
71. Above the previous maximum for the past 4 months straight now
Amazing.
Printer Friendly | Permalink |  | Top
 
joshcryer Donating Member (1000+ posts) Send PM | Profile | Ignore Thu Apr-08-10 11:48 PM
Response to Reply #71
72. It's tighening a bit, but was expected. Should stay above the rest.
No more cool days in our forecast here. Of course, weather isn't an indicator, but I expect maybe one or two more cold spells for the United States, and that'll be all she wrote for the summer.
Printer Friendly | Permalink |  | Top
 
Systematic Chaos Donating Member (1000+ posts) Send PM | Profile | Ignore Mon Apr-12-10 07:34 AM
Response to Reply #72
75. The "tightening" has untightened. Your next post of the graph should reflect this.
And the band played on!

:shrug:
Printer Friendly | Permalink |  | Top
 
OnlinePoker Donating Member (837 posts) Send PM | Profile | Ignore Fri Apr-09-10 08:27 AM
Response to Reply #70
73. The one thing I don't like about these graphs
is the scale is in celsius but the note in the graph says farenheit. I know it's for American consumption, but it's a scientific organization and they should use the metric equivalent exclusively.
Printer Friendly | Permalink |  | Top
 
joshcryer Donating Member (1000+ posts) Send PM | Profile | Ignore Sun Apr-11-10 10:20 PM
Response to Reply #73
74. Yeah, it is a bit annoying.
Printer Friendly | Permalink |  | Top
 
joshcryer Donating Member (1000+ posts) Send PM | Profile | Ignore Fri Apr-16-10 12:11 PM
Response to Original message
76. April 14th, cooler than 2005. 2nd warmest month on record. Damn volcanos.
Printer Friendly | Permalink |  | Top
 
joshcryer Donating Member (1000+ posts) Send PM | Profile | Ignore Fri Apr-23-10 02:38 PM
Response to Original message
77. April 21st makes this warmest month on record (warm spike):
Printer Friendly | Permalink |  | Top
 
Systematic Chaos Donating Member (1000+ posts) Send PM | Profile | Ignore Fri Apr-23-10 06:16 PM
Response to Reply #77
78. I KNEW this was going to happen.
Fuck and more fuck. :banghead:
Printer Friendly | Permalink |  | Top
 
joshcryer Donating Member (1000+ posts) Send PM | Profile | Ignore Sun Apr-25-10 08:10 PM
Response to Reply #78
79. Yep, going to be an interesting summer.
Knew it wouldn't deviate from the past trend (of at minimum .5C higher) either. I guess those NASA folks who predicted this* are just crazy fools.

* PDF: http://data.giss.nasa.gov/gistemp/paper/gistemp2010_draft0319.pdf
Printer Friendly | Permalink |  | Top
 
joshcryer Donating Member (1000+ posts) Send PM | Profile | Ignore Thu Apr-29-10 06:21 AM
Response to Original message
80. April 27st makes this warmest month on record (up up and away!):
Printer Friendly | Permalink |  | Top
 
Viking12 Donating Member (1000+ posts) Send PM | Profile | Ignore Thu Apr-29-10 10:37 AM
Response to Reply #80
81. Looks like we'll break the record for a 12-month period that we set only last month.
Printer Friendly | Permalink |  | Top
 
joshcryer Donating Member (1000+ posts) Send PM | Profile | Ignore Fri Apr-30-10 12:42 AM
Response to Reply #81
82. Yeah, warmest first quarter in modern history, by all accounts.
Deniers are going to whine, it's Spencer's data.
Printer Friendly | Permalink |  | Top
 
joshcryer Donating Member (1000+ posts) Send PM | Profile | Ignore Sun May-02-10 04:25 PM
Response to Original message
83. April was warmest month on record (by far):


April had one "cool" day which was cooler than the record year of 2005. Otherwise every single day in April was warmer than any time on record.
Printer Friendly | Permalink |  | Top
 
joshcryer Donating Member (1000+ posts) Send PM | Profile | Ignore Mon May-03-10 05:01 PM
Response to Original message
84. May 1st makes this warmest month on record (pop goes the weasel):


Any bets on how nasty this summer is going to get?
Printer Friendly | Permalink |  | Top
 
joshcryer Donating Member (1000+ posts) Send PM | Profile | Ignore Sun May-09-10 06:02 AM
Response to Original message
85. May 7th makes this warmest month on record (summer beckons):
Wonder if it'll slow down the rise.

Printer Friendly | Permalink |  | Top
 
Systematic Chaos Donating Member (1000+ posts) Send PM | Profile | Ignore Mon May-10-10 04:23 PM
Response to Reply #85
86. It just won't give up, will it?
:(
Printer Friendly | Permalink |  | Top
 
joshcryer Donating Member (1000+ posts) Send PM | Profile | Ignore Mon May-10-10 11:40 PM
Response to Reply #86
87. No sign of slowing down either.
Going to be one hot summer, despite the current cold front that will be hitting the midwest.
Printer Friendly | Permalink |  | Top
 
joshcryer Donating Member (1000+ posts) Send PM | Profile | Ignore Sun May-16-10 06:11 AM
Response to Original message
88. May 14th makes this warmest month on record (don't worry, we got it under control):
Review of Energy Solutions proves that we're on the right track and this isn't happening. Didn't you get the memo? Nuclear winter is a far more dangerous threat than global warming.


FYI, I'm being sarcastic. A couple of thousand people are going to die this summer.
Printer Friendly | Permalink |  | Top
 
joshcryer Donating Member (1000+ posts) Send PM | Profile | Ignore Sun May-23-10 02:44 AM
Response to Original message
89. May 21st makes this warmest month on record:


Prediction:

Printer Friendly | Permalink |  | Top
 
Systematic Chaos Donating Member (1000+ posts) Send PM | Profile | Ignore Mon May-31-10 01:59 AM
Response to Reply #89
90. So far that "prediction" line is holding pretty true.
Jesus H Christ on a crutch. :(
Printer Friendly | Permalink |  | Top
 
joshcryer Donating Member (1000+ posts) Send PM | Profile | Ignore Mon May-31-10 05:33 AM
Response to Reply #90
91. Yep. :( Here's May 29th (forgot to update):
Printer Friendly | Permalink |  | Top
 
joshcryer Donating Member (1000+ posts) Send PM | Profile | Ignore Mon May-31-10 05:48 AM
Response to Reply #90
92. Here's a gif animation (2 sec delay):


Don't know if it can continue through all of June but it's not bad. :)
Printer Friendly | Permalink |  | Top
 
joshcryer Donating Member (1000+ posts) Send PM | Profile | Ignore Wed Jun-02-10 08:08 AM
Response to Original message
93. May was warmest month on record (by far and away):


Changed the format of the copy-paste, since it's nearly a half size reduction by just copying the temperature, see the OP for the scales. Also, looks like my "prediction" is out the window already, but I'd be surprised if it didn't stay within 5-10 pixels of it.
Printer Friendly | Permalink |  | Top
 
joshcryer Donating Member (1000+ posts) Send PM | Profile | Ignore Thu Jun-03-10 11:44 AM
Response to Original message
94. June 1st makes this warmest month on record:
Printer Friendly | Permalink |  | Top
 
Systematic Chaos Donating Member (1000+ posts) Send PM | Profile | Ignore Mon Jun-07-10 03:44 AM
Response to Reply #94
95. The Orange Line of Terror (tm) is drawing a LITTLE closer to its brethren on the graph.
I just checked it at the link. Still about half a degree above all the other lines, but not as far above as a month ago.
Printer Friendly | Permalink |  | Top
 
joshcryer Donating Member (1000+ posts) Send PM | Profile | Ignore Tue Jun-08-10 11:52 AM
Response to Reply #95
96. I think it's in for another spike.
If you look at the past trends it kinda slows down late may mid June but then speeds up again.
Printer Friendly | Permalink |  | Top
 
joshcryer Donating Member (1000+ posts) Send PM | Profile | Ignore Tue Jun-08-10 08:30 PM
Response to Original message
97. June 7th makes this warmest month on record:
Printer Friendly | Permalink |  | Top
 
The Croquist Donating Member (1000+ posts) Send PM | Profile | Ignore Wed Jun-09-10 09:00 AM
Response to Reply #97
98. The numbers are somewhat deceiving
You are posting that daily temperatures that only go back to August 3 1998 make this the hottest year in the 30 year satellite record. The reason that the first 5 months were the hottest is that 1998 is not included.

..............2010...1998
January....0.648..0.582
February...0.603..0.753
March.......0.653..0.528
April.........0.501..0.770
May.........0.534..0.645
Average..0.588..0.656

None of that means that 2010 isn't hot but it isn't the hottest.

Printer Friendly | Permalink |  | Top
 
joshcryer Donating Member (1000+ posts) Send PM | Profile | Ignore Wed Jun-09-10 01:39 PM
Response to Reply #98
99. Where are you getting your data?
FYI the latter part of 1998 is on that graph.
Printer Friendly | Permalink |  | Top
 
joshcryer Donating Member (1000+ posts) Send PM | Profile | Ignore Wed Jun-09-10 01:46 PM
Response to Reply #98
100. I found the source, you are correct.
Edited on Wed Jun-09-10 01:47 PM by joshcryer
1998 must have been a strange year, with the former part of the year significantly warmer than the latter. I assumed visually that 1998 would have been graphed on the other side about the same.

However, it is certain that 2010 will be the warmest year on record, including the satellite trends.

But thanks for pointing that out. I will put a disclaimer next time I update.

edit: source: http://vortex.nsstc.uah.edu/data/msu/t2lt/

(BTW, it was totally unintentional so "deceit" is a bit presumptive of you.)
Printer Friendly | Permalink |  | Top
 
The Croquist Donating Member (1000+ posts) Send PM | Profile | Ignore Wed Jun-09-10 03:20 PM
Response to Reply #100
101. Sorry. I didn't mean to infer that you were deceiving
but that because 1998 starts in August it didn't include the warmest satellite year.

Your link is good but the monthly data is specifically at:
http://vortex.nsstc.uah.edu/data/msu/t2lt/tltglhmam_5.3

It used to be
http://vortex.nsstc.uah.edu/data/msu/t2lt/tltglhmam_5.2

But they changed it a few months ago. I only noticed it when they stopped updating the old one.

1998 was indeed a strange year. If you chart it you will see how out of kilter it is. If it wasn't for the fact that the surface data supports it I would question it's accuracy. I'm sure lots of people questioned it but as they say at Realclimate.com "it is robust". I'd post a chart but I don't know how.

2010 is hot so far but I don't think it will beat out 1998. The El Nino appears to be fading and if it does, temperatures will start dropping.


Printer Friendly | Permalink |  | Top
 
joshcryer Donating Member (1000+ posts) Send PM | Profile | Ignore Fri Sep-03-10 09:05 AM
Response to Reply #100
134. delete
Edited on Fri Sep-03-10 09:07 AM by joshcryer
was looking to see uf tgey;d updated the ftp yet, posted in wrong spot

Printer Friendly | Permalink |  | Top
 
joshcryer Donating Member (1000+ posts) Send PM | Profile | Ignore Tue Jun-15-10 05:42 PM
Response to Original message
104. delete
Edited on Tue Jun-15-10 05:43 PM by joshcryer
not updated yet, few more hours I guess
Printer Friendly | Permalink |  | Top
 
pscot Donating Member (1000+ posts) Send PM | Profile | Ignore Tue Jun-15-10 05:52 PM
Response to Original message
105. This may become the 2nd thread that never dies
n/t
Printer Friendly | Permalink |  | Top
 
joshcryer Donating Member (1000+ posts) Send PM | Profile | Ignore Tue Jun-15-10 05:54 PM
Response to Reply #105
106. Hehe, sorry for bumping it, I didn't realize they hadn't yet updated for the 14th.
Only 30 more updates or thereabouts though. I could continue it if 2011 is also an warm year, but I don't really expect it.
Printer Friendly | Permalink |  | Top
 
joshcryer Donating Member (1000+ posts) Send PM | Profile | Ignore Tue Jun-15-10 07:19 PM
Response to Original message
107. June 14th makes this warmest month this decade:
As was pointed out to me by The Croquist, my assumptions were wrong for several months in the past year. They did not in fact beat the monthly period for 1998. While I still believe that 2010 will most certainly be warmer than 1998 as an aggregate, clearly the first half of 1998 was quite an unusual year, and was quite warm. See the subthread under post #97 for the explanation.

Since the raw UAH sources are not updated as regularly as their graphic site (that I know of anyway), I cannot actually compare week on week. However, at the end of the year I'll certainly do a comparison between 2010 and 1998. If 2010 is warmer by the time August comes around (when the 1998 temperature record starts up again on the provided graph) I will change my wording back to "month warmest on record" rather "this decade."


Thanks again to The Croquist, and hopefully I won't be so presumptive in the future. Apologies to him for any misunderstanding.
Printer Friendly | Permalink |  | Top
 
The Croquist Donating Member (1000+ posts) Send PM | Profile | Ignore Thu Jun-24-10 09:12 AM
Response to Reply #107
110. Thank you.
Damn I wish it would cool down.

Roy Spencer and others have been predicting a La Nina for some time and there are indications we will soon be in it. That should cool things off.

I've got spreadsheets with the UAH & RSS data if you would like it.
Printer Friendly | Permalink |  | Top
 
joshcryer Donating Member (1000+ posts) Send PM | Profile | Ignore Thu Jun-24-10 02:01 AM
Response to Original message
108. June 22nd makes this warmest month this decade:
Couldn't update for June 21st, had a nephew being delivered. :)

Printer Friendly | Permalink |  | Top
 
XemaSab Donating Member (1000+ posts) Send PM | Profile | Ignore Thu Jun-24-10 02:41 AM
Response to Reply #108
109. Congratulations, and thanks for the update
:hi:
Printer Friendly | Permalink |  | Top
 
joshcryer Donating Member (1000+ posts) Send PM | Profile | Ignore Wed Jun-30-10 02:36 AM
Response to Original message
111. June 28th makes this warmest month this decade:
Printer Friendly | Permalink |  | Top
 
AtheistCrusader Donating Member (1000+ posts) Send PM | Profile | Ignore Thu Jul-01-10 01:34 AM
Response to Original message
112. Not in the Pacific Northwest.
I don't know what the hell is going on here, but we've barely had any spring at all, and Summer just hasn't arrived. We're missing a whole month of 70-80 degree temps. It just never materialized.

Hate to think what might be happening elsewhere, if the global average is so high.

The weather has just gone wierd around here.
Printer Friendly | Permalink |  | Top
 
joshcryer Donating Member (1000+ posts) Send PM | Profile | Ignore Fri Jul-02-10 05:24 AM
Response to Original message
113. June was warmest month this decade:
Printer Friendly | Permalink |  | Top
 
Systematic Chaos Donating Member (1000+ posts) Send PM | Profile | Ignore Fri Jul-02-10 07:04 AM
Response to Reply #113
114. Looks like the line will have no problem staying above the blue outlier coming up.
Whatever year that was -- I presume 1998? :(
Printer Friendly | Permalink |  | Top
 
Viking12 Donating Member (1000+ posts) Send PM | Profile | Ignore Fri Jul-02-10 07:17 AM
Response to Reply #114
115. That graph only shows 1998 data from August 1 onward
Thus, that graph cannot be used to compare Jan-Jul 2010 to Jan-Jul 1998.
BTW: 1998 is represented by a red line. The blue line is 2009.
Printer Friendly | Permalink |  | Top
 
The Croquist Donating Member (1000+ posts) Send PM | Profile | Ignore Tue Jul-06-10 06:26 AM
Response to Reply #113
116. The unofficial UAH June number is +0.436 C.
It is on Roy Spenser's blog:
http://www.drroyspencer.com/

..............2010...1998
January....0.648..0.582
February...0.603..0.753
March.......0.653..0.528
April.........0.501..0.770
May.........0.534..0.645
June........0.436..0.562

Average...0.542..0.640

Printer Friendly | Permalink |  | Top
 
joshcryer Donating Member (1000+ posts) Send PM | Profile | Ignore Fri Jul-09-10 03:21 PM
Response to Original message
117. July 7th makes this warmest month this decade (but can we beat 2009?):
Edited on Fri Jul-09-10 03:34 PM by joshcryer
Printer Friendly | Permalink |  | Top
 
joshcryer Donating Member (1000+ posts) Send PM | Profile | Ignore Fri Jul-16-10 10:10 AM
Response to Original message
118. July 14th makes this warmest month this decade (and yep, we might just beat 2009):
Printer Friendly | Permalink |  | Top
 
Systematic Chaos Donating Member (1000+ posts) Send PM | Profile | Ignore Sat Jul-17-10 07:33 AM
Response to Reply #118
119. With ease.
And I'm starting to think that every successive year is going to be more and more likely to end up above all the ones before it.
Printer Friendly | Permalink |  | Top
 
joshcryer Donating Member (1000+ posts) Send PM | Profile | Ignore Fri Jul-23-10 01:11 AM
Response to Original message
120. July 21st makes this warmest month this decade:


Hopefully it will stay just above 2009 as it cools down, otherwise denialists will claim that "1998 was still warmer" or that "1998 was almost as hot."
Printer Friendly | Permalink |  | Top
 
joshcryer Donating Member (1000+ posts) Send PM | Profile | Ignore Fri Jul-30-10 02:09 PM
Response to Original message
121. July 28th makes this warmest month this decade:
Printer Friendly | Permalink |  | Top
 
joshcryer Donating Member (1000+ posts) Send PM | Profile | Ignore Mon Aug-02-10 11:50 PM
Response to Original message
122. August 1st makes this warmest month this decade:
Printer Friendly | Permalink |  | Top
 
The Croquist Donating Member (1000+ posts) Send PM | Profile | Ignore Tue Aug-03-10 09:53 AM
Response to Reply #122
123. Unofficial UAH July temperature:
2010 came in at 0.489 second only to 1998 at 0.510 as the warmest in the 32 year record.

MTH 1998 2010 1998 - 2010
Jan 0.582 0.648 -0.066
Feb 0.753 0.603 0.150
Mar 0.528 0.653 -0.125
Apr 0.77 0.501 0.269
May 0.645 0.534 0.111
Jun 0.562 0.436 0.126
Jul 0.51 0.489 0.021

AVG 0.621 0.552 0.069


Printer Friendly | Permalink |  | Top
 
joshcryer Donating Member (1000+ posts) Send PM | Profile | Ignore Tue Aug-03-10 12:28 PM
Response to Reply #123
124. The gap closed from June to July by .029.
If the gap continues to close at that rate then 2010 will be warmer than 1998 in just under two and a half months.
Printer Friendly | Permalink |  | Top
 
joshcryer Donating Member (1000+ posts) Send PM | Profile | Ignore Sun Aug-08-10 06:48 PM
Response to Original message
125. August 7th makes this warmest month on record:


2010 will almost certainly be warmer than 1998 if any of these trends continue. We would need an unusually cold winter for that not to be the case.
Printer Friendly | Permalink |  | Top
 
joshcryer Donating Member (1000+ posts) Send PM | Profile | Ignore Sun Aug-08-10 06:51 PM
Response to Reply #125
126. 1998, 2009, 2010


So it's easier to see the trending.
Printer Friendly | Permalink |  | Top
 
joshcryer Donating Member (1000+ posts) Send PM | Profile | Ignore Sun Aug-15-10 10:41 PM
Response to Original message
127. August 14th makes this warmest month on record:


Gap should close between 1998 and 2010 very quickly if this trend continues.
Printer Friendly | Permalink |  | Top
 
emmadoggy Donating Member (1000+ posts) Send PM | Profile | Ignore Tue Aug-24-10 12:19 AM
Response to Original message
128. Update this week? nt
Printer Friendly | Permalink |  | Top
 
joshcryer Donating Member (1000+ posts) Send PM | Profile | Ignore Tue Aug-24-10 12:59 AM
Response to Reply #128
130. They were like 3 days behind with updating, but I guess they caught up, weird.
Printer Friendly | Permalink |  | Top
 
joshcryer Donating Member (1000+ posts) Send PM | Profile | Ignore Tue Aug-24-10 12:58 AM
Response to Original message
129. August 22nd makes this warmest month on record:
Edited on Tue Aug-24-10 01:01 AM by joshcryer


Printer Friendly | Permalink |  | Top
 
joshcryer Donating Member (1000+ posts) Send PM | Profile | Ignore Mon Aug-30-10 02:25 AM
Response to Original message
131. August 28th makes this warmest month on record (exciting!):


2010 appears to be dropping hard here. Possibly equalizing? Could put a dent in 2010 being warmer than 1998.
Printer Friendly | Permalink |  | Top
 
The Croquist Donating Member (1000+ posts) Send PM | Profile | Ignore Mon Aug-30-10 06:40 AM
Response to Reply #131
132. It could be caused by the La Nina
If so, expect it to continue to cool.
Printer Friendly | Permalink |  | Top
 
joshcryer Donating Member (1000+ posts) Send PM | Profile | Ignore Wed Sep-01-10 09:37 PM
Response to Original message
133. August 31st makes August warmest on record:
Edited on Wed Sep-01-10 09:37 PM by joshcryer


Printer Friendly | Permalink |  | Top
 
joshcryer Donating Member (1000+ posts) Send PM | Profile | Ignore Fri Sep-03-10 09:08 AM
Response to Original message
135. September 1st makes this warmest month on record:


Printer Friendly | Permalink |  | Top
 
joshcryer Donating Member (1000+ posts) Send PM | Profile | Ignore Fri Sep-03-10 09:13 AM
Response to Reply #135
136. Gap closed again by .02:
Printer Friendly | Permalink |  | Top
 
joshcryer Donating Member (1000+ posts) Send PM | Profile | Ignore Thu Sep-09-10 08:08 AM
Response to Original message
137. September 7th makes this warmest month on record:


Printer Friendly | Permalink |  | Top
 
joshcryer Donating Member (1000+ posts) Send PM | Profile | Ignore Thu Sep-16-10 02:40 AM
Response to Original message
138. September 14th makes this second warmest month on record (still warmer than 1998):


Bit cooler than this time last year, but we had a really abnormally warm late summer / early fall. I don't think we even had a fall last year to my recollection, it was just warm one day and cold the next, here.
Printer Friendly | Permalink |  | Top
 
joshcryer Donating Member (1000+ posts) Send PM | Profile | Ignore Thu Sep-16-10 02:56 AM
Response to Reply #138
139. But the gap between July and August did not close much at all:
2010 1 0.648
2010 2 0.603
2010 3 0.653
2010 4 0.501
2010 5 0.534
2010 6 0.436
2010 7 0.489
2010 8 0.511
2010 Avg 0.546

1998 1 0.582
1998 2 0.753
1998 3 0.528
1998 4 0.770
1998 5 0.645
1998 6 0.562
1998 7 0.510
1998 8 0.518
1998 Avg 0.608

July's difference was 0.069, August is .061. The gap closed by .007 not .02 as previously stated.

Printer Friendly | Permalink |  | Top
 
joshcryer Donating Member (1000+ posts) Send PM | Profile | Ignore Wed Sep-22-10 08:23 PM
Response to Original message
140. September 21st makes this second warmest month on record (still warmer than 1998):


Printer Friendly | Permalink |  | Top
 
joshcryer Donating Member (1000+ posts) Send PM | Profile | Ignore Thu Sep-30-10 03:43 AM
Response to Original message
141. September 28th makes this warmest month on record:
(4 out of 7 days this past week were considerably warmer than 2009.)


Printer Friendly | Permalink |  | Top
 
joshcryer Donating Member (1000+ posts) Send PM | Profile | Ignore Sat Oct-02-10 08:37 PM
Response to Original message
142. October 1st makes this warmest month on record:


Printer Friendly | Permalink |  | Top
 
joshcryer Donating Member (1000+ posts) Send PM | Profile | Ignore Fri Oct-08-10 07:19 PM
Response to Original message
145. October 7st makes this warmest month on record:


Printer Friendly | Permalink |  | Top
 
joshcryer Donating Member (1000+ posts) Send PM | Profile | Ignore Sat Oct-16-10 12:05 AM
Response to Original message
146. October 14th makes this warmest month on record:


Printer Friendly | Permalink |  | Top
 
Systematic Chaos Donating Member (1000+ posts) Send PM | Profile | Ignore Sat Oct-16-10 12:58 AM
Response to Reply #146
147. Even with last year, sorta-kinda, but CRUSHING 1998.
Yup, some records are about to fall come January 1, 2011.
Printer Friendly | Permalink |  | Top
 
joshcryer Donating Member (1000+ posts) Send PM | Profile | Ignore Sat Oct-16-10 01:21 AM
Response to Reply #147
148. Thanks, that reminds me, Sept. temps should be on the ASMU site...
Wonder if the gap closed much at all between August/Sept.
Printer Friendly | Permalink |  | Top
 
joshcryer Donating Member (1000+ posts) Send PM | Profile | Ignore Sat Oct-16-10 01:34 AM
Response to Reply #146
149. August was 0.061, September was 0.038, the gap closed by 0.023 C.
2010 1 0.648
2010 2 0.603
2010 3 0.653
2010 4 0.501
2010 5 0.534
2010 6 0.436
2010 7 0.489
2010 8 0.511
2010 9 0.603
2010 Avg 0.553


1998 1 0.582
1998 2 0.753
1998 3 0.528
1998 4 0.770
1998 5 0.645
1998 6 0.562
1998 7 0.510
1998 8 0.518
1998 9 0.458
1998 Avg 0.591

0.591 - 0.553 = 0.038

August was 0.061, September was 0.038, the gap closed by 0.023 C.
Printer Friendly | Permalink |  | Top
 
joshcryer Donating Member (1000+ posts) Send PM | Profile | Ignore Fri Oct-22-10 08:19 PM
Response to Original message
150. October 21st makes this warmest month on record:


The longer we stay above or near 2009 the more likely it is that we'll certainly beat 1998 overall.
Printer Friendly | Permalink |  | Top
 
joshcryer Donating Member (1000+ posts) Send PM | Profile | Ignore Sat Oct-30-10 04:07 AM
Response to Original message
152. October 28th tied three months this past decade, warmer than 1998:


Printer Friendly | Permalink |  | Top
 
joshcryer Donating Member (1000+ posts) Send PM | Profile | Ignore Tue Nov-02-10 08:08 PM
Response to Original message
153. Oct. was warmest month on record, Nov. looking to take over:
While Oct. tied several weeks in the past, it's clear that it was as an aggregate the warmest on the satellite record.


It will be interesting to see how 2010 fared against 1998, but I won't be able to access the UAH data for another two weeks. As far as I can tell it looks to be a wash, like Aug. was. However, 1998 had an extremely cool dip toward the end. If Nov. and Dec. continue to be even remotely close to 2009, it will be all over for 1998 as a record year.
Printer Friendly | Permalink |  | Top
 
wtmusic Donating Member (1000+ posts) Send PM | Profile | Ignore Tue Nov-02-10 09:30 PM
Response to Reply #153
154. 92º in L.A. tomorrow. In November.
:(
Printer Friendly | Permalink |  | Top
 
joshcryer Donating Member (1000+ posts) Send PM | Profile | Ignore Wed Nov-03-10 07:26 PM
Response to Reply #154
159. :(
Printer Friendly | Permalink |  | Top
 
Viking12 Donating Member (1000+ posts) Send PM | Profile | Ignore Wed Nov-03-10 03:19 PM
Response to Reply #153
155. According to my calculations, an avg anomaly of 0.4 over OctNovDec would make 2010 warmer than 1998
The average anomaly Jan-Sept 2010 was ~0.55


OctNovDec 1998 average anomaly was 0.29
Printer Friendly | Permalink |  | Top
 
joshcryer Donating Member (1000+ posts) Send PM | Profile | Ignore Wed Nov-03-10 07:26 PM
Response to Reply #155
157. Interesting.
Printer Friendly | Permalink |  | Top
 
kestrel91316 Donating Member (1000+ posts) Send PM | Profile | Ignore Wed Nov-03-10 05:26 PM
Response to Original message
156. Mini heat wave in SoCal right now, 3 days of mid-to-upper 90's.......
Printer Friendly | Permalink |  | Top
 
joshcryer Donating Member (1000+ posts) Send PM | Profile | Ignore Wed Nov-03-10 07:26 PM
Response to Reply #156
158. I almost envy you. Where's our global warming in CO!
Printer Friendly | Permalink |  | Top
 
Nihil Donating Member (1000+ posts) Send PM | Profile | Ignore Thu Nov-04-10 04:42 AM
Response to Reply #156
160. I've noticed
I get temperature alerts from our LA server room and you've certainly
had your fair share of high temperatures this year ...
:hi:
Printer Friendly | Permalink |  | Top
 
meow mix Donating Member (1000+ posts) Send PM | Profile | Ignore Thu Nov-04-10 08:53 AM
Response to Original message
161. extremely warm and dry up here in montana still!
this is crazy
Printer Friendly | Permalink |  | Top
 
joshcryer Donating Member (1000+ posts) Send PM | Profile | Ignore Tue Nov-09-10 01:24 AM
Response to Original message
162. Nov. 7th makes this warmest month on record (whoa):
Edited on Tue Nov-09-10 01:25 AM by joshcryer
Didn't expect 2010 to be warmer than 2009, thought it would dip down and be within the other years. Really remarkable, showing that 1998 was indeed a major outlier, and that 2010 is a *new baseline* for which temperatures will follow over time.


Printer Friendly | Permalink |  | Top
 
joshcryer Donating Member (1000+ posts) Send PM | Profile | Ignore Thu Nov-11-10 10:19 PM
Response to Reply #162
163. The gap between Sept. and Oct. did not close at all though.
2010 1 0.648
2010 2 0.603
2010 3 0.653
2010 4 0.501
2010 5 0.534
2010 6 0.436
2010 7 0.489
2010 8 0.511
2010 9 0.603
2010 10 0.419
2010 Avg 0.539

1998 1 0.582
1998 2 0.753
1998 3 0.528
1998 4 0.770
1998 5 0.645
1998 6 0.562
1998 7 0.510
1998 8 0.518
1998 9 0.458
1998 10 0.416
1998 Avg 0.574

0.574 - 0.539 = 0.038

Kind of expected this with how close 2010 and 1998 were to one another.
Printer Friendly | Permalink |  | Top
 
Systematic Chaos Donating Member (1000+ posts) Send PM | Profile | Ignore Sun Nov-14-10 08:49 AM
Response to Reply #162
164. Just wait for the next solar maximum.
Good times.
Printer Friendly | Permalink |  | Top
 
joshcryer Donating Member (1000+ posts) Send PM | Profile | Ignore Mon Nov-15-10 06:37 PM
Response to Original message
165. Nov. 14th makes this warmest month on record:
Slightly surprised by this result because the default for this app is last year + this year, so I thought it would've at least been cooler than some previous years, but nope, so far Nov. up until the 14th is the warmest on the satellite record.


Printer Friendly | Permalink |  | Top
 
joshcryer Donating Member (1000+ posts) Send PM | Profile | Ignore Mon Nov-22-10 09:59 PM
Response to Original message
166. Nov. 21st big drop:
Note: the date on this is all fubar'd, the actual data is on the 21st though if you follow it. This really puts in to question whether or not 2010 will be warmer than 1998. It needed to stay up by 2009 pretty much the whole way. It's going to be really really REALLY close.


Printer Friendly | Permalink |  | Top
 
OnlinePoker Donating Member (837 posts) Send PM | Profile | Ignore Tue Nov-23-10 09:03 PM
Response to Reply #166
167. When you talk warmer than '98, do you mean the whole year?
Because for most of this year it's been a degree or so above so if it dips below '98 in December, it will still have been a warmer year averaged over the whole period. I also think this topic should be wrapped up and a new one started; there's a lot of graphics which I have no issue with, but those with slower connections might have difficulty downloading. You can always link back to this one for anybody who wants to see older info.
Printer Friendly | Permalink |  | Top
 
joshcryer Donating Member (1000+ posts) Send PM | Profile | Ignore Tue Nov-23-10 09:59 PM
Response to Reply #167
168. The graph doesn't have the full 1998 year.
Apparently the first half of 1998 was still warmer than 2010 (remarkably so). This thread will likely take a few seconds to load, but each graphic is only 10-15k. Don't click "view all" if you don't want all the graphics to load.

So yeah, the verdict is still out on whether or not 1998 was warmer overall than 2010.
Printer Friendly | Permalink |  | Top
 
joshcryer Donating Member (1000+ posts) Send PM | Profile | Ignore Thu Dec-02-10 06:59 PM
Response to Original message
169. Nov. in top 5 warmest months on record, Dec. looking to keep the pace:
Going to be 66 degrees here in Colorado tomorrow. The average for this time of year is 45. I'm not hating global warming so far... :P


Printer Friendly | Permalink |  | Top
 
joshcryer Donating Member (1000+ posts) Send PM | Profile | Ignore Sun Dec-05-10 07:03 AM
Response to Original message
170. Nov. 2010 UAH Global Temperature Update: +0.38 deg. C
Printer Friendly | Permalink |  | Top
 
joshcryer Donating Member (1000+ posts) Send PM | Profile | Ignore Sat Dec-11-10 10:15 PM
Response to Original message
171. Dec 10:
Forgot to update for the 1st, here's the 10th:


Going to be close.
Printer Friendly | Permalink |  | Top
 
joshcryer Donating Member (1000+ posts) Send PM | Profile | Ignore Thu Dec-16-10 03:16 AM
Response to Original message
172. Dec. 14:


Printer Friendly | Permalink |  | Top
 
joshcryer Donating Member (1000+ posts) Send PM | Profile | Ignore Thu Dec-16-10 03:24 AM
Response to Reply #172
173. Gap between Oct-Nov:
Edited on Thu Dec-16-10 03:25 AM by joshcryer
2010 1 0.648
2010 2 0.603
2010 3 0.653
2010 4 0.501
2010 5 0.534
2010 6 0.436
2010 7 0.489
2010 8 0.511
2010 9 0.603
2010 10 0.419
2010 11 0.381
2010 Avg 0.525

1998 1 0.582
1998 2 0.753
1998 3 0.528
1998 4 0.770
1998 5 0.645
1998 6 0.562
1998 7 0.510
1998 8 0.518
1998 9 0.458
1998 10 0.416
1998 11 0.192
1998 Avg 0.539

0.525 - 0.539 = 0.014

Gap closed by 0.024, another month like that and 98 goes in the history books on the satellite record (already doused by GISS).
Printer Friendly | Permalink |  | Top
 
The Croquist Donating Member (1000+ posts) Send PM | Profile | Ignore Fri Jan-07-11 12:05 PM
Response to Reply #173
178. New "Improved" UAH 30 year base numbers
2010 1 0.542
2010 2 0.51
2010 3 0.554
2010 4 0.4
2010 5 0.454
2010 6 0.385
2010 7 0.419
2010 8 0.441
2010 9 0.477
2010 10 0.306
2010 11 0.273 2010 Ave (thru Nov.) 0.433
2010 12 0.18 2010 Ave (thru Dec.) 0.412

1998 1 0.477
1998 2 0.660
1998 3 0.429
1998 4 0.668
1998 5 0.565
1998 6 0.511
1998 7 0.441
1998 8 0.449
1998 9 0.333
1998 10 0.296
1998 11 0.083 1998 Ave (thru Nov.) 0.447
1998 12 0.196 1998 Ave (thru Dec.) 0.426

The gap up until November was 0.433 - 0.447 = -0.014 which is the same as yours (you forgot the sign) so as Spencer said the 30 year base period doesn't impact the trend.

Thru year end the gap is 0.412 - 0.426 = -0.014


Printer Friendly | Permalink |  | Top
 
joshcryer Donating Member (1000+ posts) Send PM | Profile | Ignore Sat Dec-18-10 05:36 AM
Response to Original message
174. Heh, heh, remember kids, while it might be cold in your neighborhood, it ain't necessarily...
...in other parts of the world.

Watch carefully. I have a suspicion that 2010 is going to end in a bang.
Printer Friendly | Permalink |  | Top
 
joshcryer Donating Member (1000+ posts) Send PM | Profile | Ignore Thu Dec-30-10 07:33 PM
Response to Original message
175. Looks like 1998 will reign supreme... I'll update next year with a more comprehensive post.
It was a really good run though.
Printer Friendly | Permalink |  | Top
 
Amonester Donating Member (1000+ posts) Send PM | Profile | Ignore Fri Dec-31-10 04:49 PM
Response to Original message
176. 2010: probably the hottest year ever recorded
Edited on Fri Dec-31-10 04:52 PM by Amonester
2010: probably the hottest year ever recorded
John Vidal - Tuesday, December 14, 2010, 8:59

http://www.worldweatherpost.com/2010/12/14/2010-probably-the-hottest-year-ever-recorded/

Read More: global temperatures, guardian, Guardian - Environment, temperature

Temperature records tumbled in Russia, Saudi Arabia, Sudan, Burma and Pakistan, causing heatwaves and devastated harvests.
heatwave russia 2010 review

2010 was the year of the heatwave, with record temperatures set in 17 countries. Two leading groups of scientists say it was the warmest since records began in 1850; another suggests it was the second-warmest.

But the year that saw an unprecedented month-long heatwave in Russia will be followed by cooler global temperatures in 2011, say climate scientists monitoring sea temperatures in the Pacific that are thought to determine temperatures around the world.

The final ranking of 2010 will not become clear until November and December data are available in early 2011, but November global temperatures are similar to those observed in November 2005, suggesting 2010 is on track for near-record levels.


:grr: :scared:


On edit: size reduced to 4 paragraphs + link
Printer Friendly | Permalink |  | Top
 
joshcryer Donating Member (1000+ posts) Send PM | Profile | Ignore Wed Jan-05-11 06:00 PM
Response to Original message
177. If you're wondering why I haven't updated, the app is broken due to missing data.
Edited on Wed Jan-05-11 06:04 PM by joshcryer
I'm waiting for them to fix it before doing an update. I trust Roy Spencer will correct any new errors with the satellites.

Here's what it looks like when I try loading it:


The rest of the channels come from the AMSU on the 12 year old NOAA-15 satellite, WHICH IS NOW EXPERIENCING LARGE AMOUNTS OF MISSING DATA AS OF AROUND DECEMBER 20, 2010. This is why some of you have noted exceptionally large temperature changes in late December. While we wait for NOAA to investigate, it seems like more than coincidence that the NOAA-15 AMSU status report had a December 17 notice that the AMSU scan motor position was being reported incorrectly due to a bit error.

http://www.drroyspencer.com/2011/01/dec-2010-uah-global-temperature-update-0-18-deg-c/


Bold emphasis mine.
Printer Friendly | Permalink |  | Top
 
joshcryer Donating Member (1000+ posts) Send PM | Profile | Ignore Fri Feb-04-11 02:25 AM
Response to Original message
179. Nothing new, just bumping this to keep from falling into the archive. If they ever fix the site...
...I want to see how 2011 is doing.
Printer Friendly | Permalink |  | Top
 
XemaSab Donating Member (1000+ posts) Send PM | Profile | Ignore Fri Feb-04-11 03:26 AM
Response to Reply #179
180. It's been a year and two days since the posting of the thread
:toast:
Printer Friendly | Permalink |  | Top
 
XemaSab Donating Member (1000+ posts) Send PM | Profile | Ignore Fri Feb-04-11 07:18 AM
Response to Reply #179
181. Does this help?
Printer Friendly | Permalink |  | Top
 
joshcryer Donating Member (1000+ posts) Send PM | Profile | Ignore Fri Feb-04-11 05:22 PM
Response to Reply #181
182. Heh.
Printer Friendly | Permalink |  | Top
 
DU AdBot (1000+ posts) Click to send private message to this author Click to view 
this author's profile Click to add 
this author to your buddy list Click to add 
this author to your Ignore list Thu May 30th 2024, 07:41 AM
Response to Original message
Advertisements [?]
 Top

Home » Discuss » Topic Forums » Environment/Energy Donate to DU

Powered by DCForum+ Version 1.1 Copyright 1997-2002 DCScripts.com
Software has been extensively modified by the DU administrators


Important Notices: By participating on this discussion board, visitors agree to abide by the rules outlined on our Rules page. Messages posted on the Democratic Underground Discussion Forums are the opinions of the individuals who post them, and do not necessarily represent the opinions of Democratic Underground, LLC.

Home  |  Discussion Forums  |  Journals |  Store  |  Donate

About DU  |  Contact Us  |  Privacy Policy

Got a message for Democratic Underground? Click here to send us a message.

© 2001 - 2011 Democratic Underground, LLC