2016 Postmortem
Related: About this forumHas anyone compared the Sanders/Clinton primary map so far to the Lincoln/Douglas map?
It looks eerily similar so far. Yes I know there is Massachusetts but considering Bill at some of voting spots and what happened to Iowa and the controversy with the coin toss. Throw those out given how close they were to ties and I wonder if Hillary will punch through in Ohio and Illinois. I suppose the same concern can be lobbied at Bernie with Florida and I truly wish him the best in getting it.
 = new reply since forum marked as read
Highlight:
NoneDon't highlight anything
5 newestHighlight 5 most recent replies
= new reply since forum marked as read
Highlight:
NoneDon't highlight anything
5 newestHighlight 5 most recent replies
revbones
(3,660 posts)
Recursion
(56,582 posts)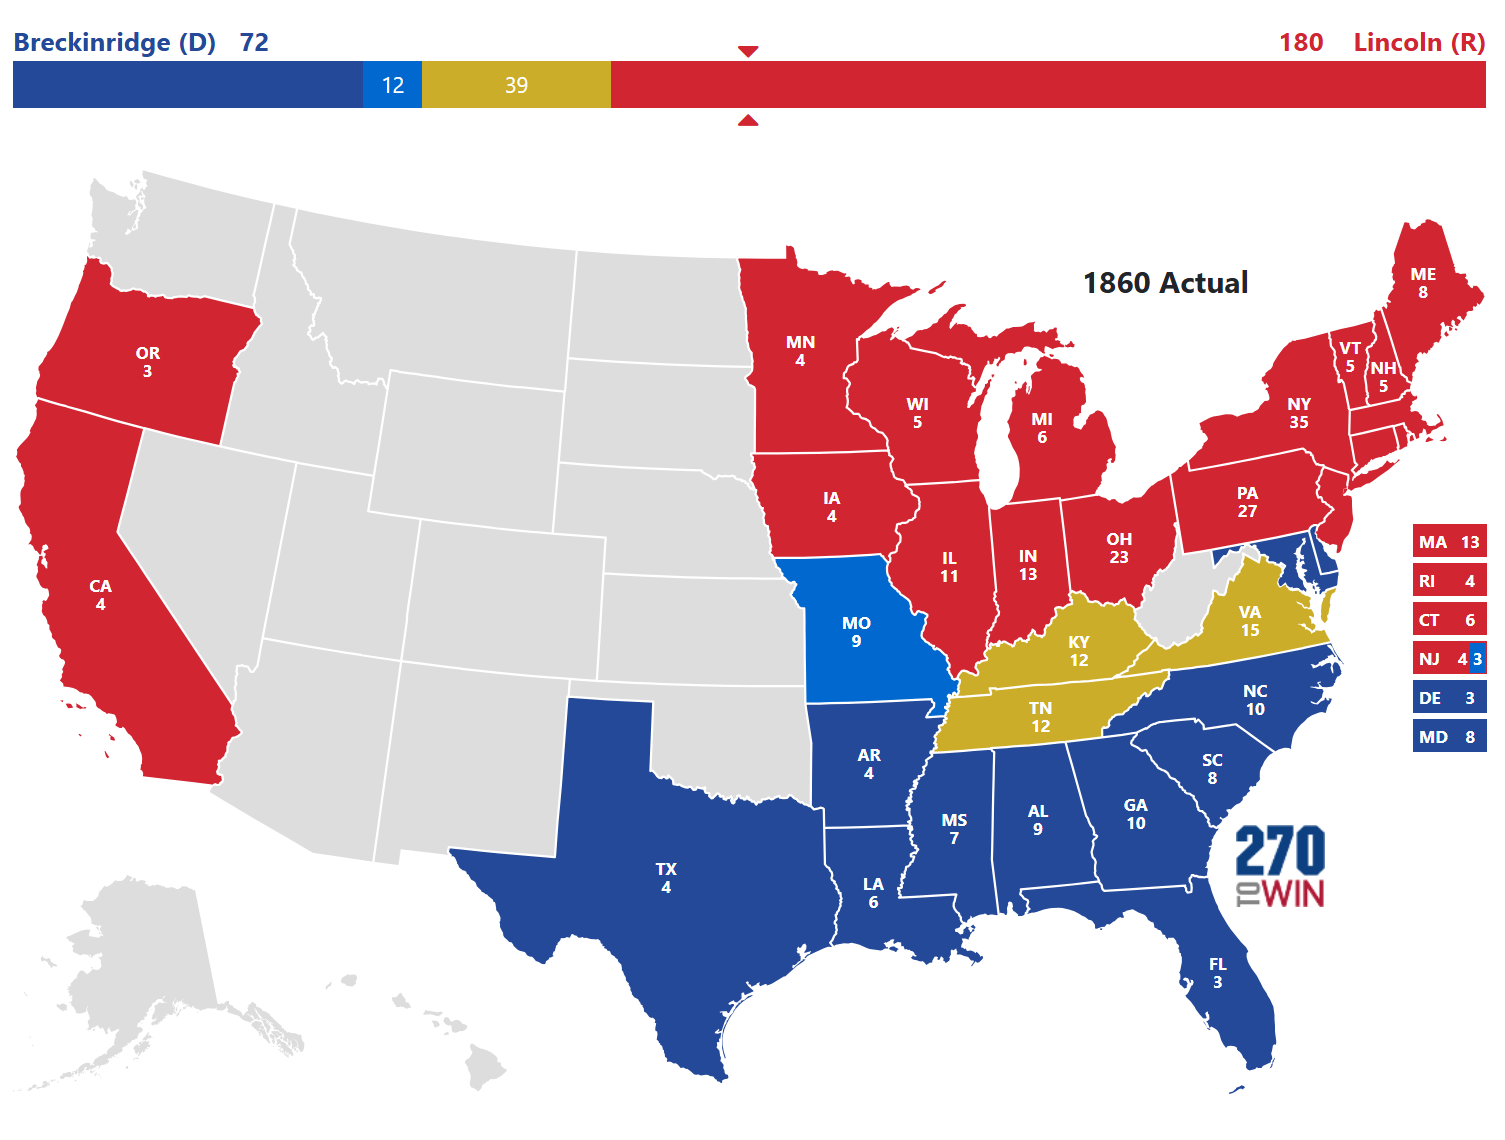
Well Douglas got some of NJ's too. Breckenridge was the much bigger competitor, and Bell ran as a spoiler against him.

PyaarRevolution
(814 posts)The point I'm making is it's such a stark North/South contrast it's disturbing to me considering the former was in the lead up to the Civil War. I might add I am in NO WAY implying any such incident will be happening in this circumstance.
Recursion
(56,582 posts)was either a Republican from California or a Democrat or Republican from the south (GHWB had been "from" Texas for decades at that point, even if he was originally from CT).
A Democrat who can win the south wins, and a Republican who can win California wins; a Republican who can keep a Democrat from winning the south can also win.
Garrett78
(10,721 posts)They're terribly misleading and simplistic. I suppose their being simplistic accounts for their appeal, but they're so misleading that they're useless. I wrote about why here: http://www.democraticunderground.com/12511460282
Recursion
(56,582 posts)Since we don't, the geographical maps give about as much information as yours, arguably more since nearly every state is winner take all in the electoral college.
Garrett78
(10,721 posts)Your comment about general election states being winner-take-all seems to be meant to suggest that winning (or losing) a state in the primary translates to winning (or losing) that state in the general election. And we know from presidential election after presidential election that that's not true. And, more importantly, the simplistic blue-red (or yellow-brown or whatever) maps treat all margins the same, be it a 0.1% margin or a 40% margin. Plus, some states have way more people than others and have to be weighted differently. Or, as I put it in that other thread:
Demographically-speaking, each state of the Deep South is more reflective of the overall Democratic electorate than each of the states Sanders has won (with the exception of Michigan, which - like Iowa and Massachusetts - was a virtual tie). As I wrote following the Michigan primary, Michigan represents the first diverse, populous "blue" state primary of this campaign. Some are claiming that Michigan proves Clinton can't win outside of the Deep South, but the sample size is way too small. And it's important to not conflate the Democratic electorate of the Deep South with the overall electorate of the Deep South. Time will tell how much Clinton struggles outside of the Deep South. Just as time will tell how successful Sanders can be outside of New England and small caucus states that lack diversity. For now, we have one -- ONE -- data point (Michigan) where the candidates were separated by a mere 18,400 votes (out of more than 1.1 million ballots), so we can't make any determinations one way or another (especially given that it was an open primary). We aren't going to learn much from Utah, Idaho, Wyoming, Delaware, etc. But March 15 (Ohio, Illinois, Missouri, Florida and North Carolina) and Arizona on the 22nd will offer more data points. In April, there's New York, Maryland and Pennsylvania. Those are the states that will determine which narrative is true (Clinton can't win outside of the Deep South vs. Sanders can't win delegate-rich states that are relatively diverse).
I would like to think most folks understand the obvious flaw in simply tallying the number of states won, yet numerous posters seem to think that's a perfectly valid form of comparison. Likewise, suggesting that Sanders being likely to win a majority of the remaining 29 states (a prediction that I think has merit) equates to him being likely to win the nomination is rather foolish. I shouldn't even have to point out that some states have *way* more people/delegates than other states--so, no, not all states are equal. Again, I'm not wanting in this thread to engage in a discussion about who is most likely to win the nomination. I'm just pointing out that one of the arguments I keep coming across is terribly flawed.
Lastly, I want to address the simplistic electoral map I've seen posted more than once. I don't think simplistic, black and white thinking is something to promote or aspire to. I vividly recall a map that was quite popular among Bush supporters following the 2000 election. It showed a map of the US in which each *county* was red or blue depending on which candidate (Bush or Gore) had won a majority (or plurality) of that county's votes. The map, of course, was overwhelmingly red. Hopefully you all can immediately understand the enormous flaw with this perspective. Counties with more cows than people are given the same weight as every other county, including Los Angeles County and Cook County (the 2 most populous counties in the US). Also, it treats a 0.1% margin of victory the same as a 40% margin of victory. This is why there are a variety of cartograms. Wikipedia defines a cartogram as "a map in which some thematic mapping variable – such as travel time, population, or Gross National Product – is substituted for land area or distance. The geometry or space of the map is distorted in order to convey the information of this alternate variable." In the case of the 2016 Democratic primaries, some states that have voted so far would be made much smaller and others would be made much bigger. And instead of showing a state in a single solid color, it would show the state in various shades/mixes of the 2 candidate colors. You can view some examples below. The map in the lower right is likely the most accurate representation of the 2004 presidential election results, but I suspect many are put off by the unfamiliarity of it. "The US doesn't look like that," one might respond. Well, politically, it does.
" target="_blank">
As for candidates losing states in the primary and then winning them in the general election, it happens frequently. If Clinton is the nominee, I don't have much doubt that she'll win the New England states, for instance. Including Vermont, where Sanders won by a huge margin.
Recursion
(56,582 posts)At that point every state except NJ was winner take all.
I'm not sure what primaries have to do with this question; the only times Lincoln ran against Douglas were the 1858 Senatorial "elections" (which weren't really elections since Senators were still appointed by the state legislature) and the 1860 Presidential election.
Garrett78
(10,721 posts)And the OP was about the primary map. The type of map shown in the OP of this thread: http://www.democraticunderground.com/?com=view_post&forum=1251&pid=1453187
alcibiades_mystery
(36,437 posts)In an election where Clinton is getting 75-85% of the African American vote in the South, you're comparing the map to Lincoln-Douglas? You do realize black folks can vote now, right? Tone deaf much?
What a shitty post.
PyaarRevolution
(814 posts)But I can't comment on thinking it's still bizarre though? 
alcibiades_mystery
(36,437 posts)Your ignorant posts are your responsibility.

Kick in to the DU tip jar?
This week we're running a special pop-up mini fund drive. From Monday through Friday we're going ad-free for all registered members, and we're asking you to kick in to the DU tip jar to support the site and keep us financially healthy.
As a bonus, making a contribution will allow you to leave kudos for another DU member, and at the end of the week we'll recognize the DUers who you think make this community great.