Democratic Underground Latest Greatest Lobby Journals Search Options Help Login
Google

Significant warming event over Antarctica

Printer-friendly format Printer-friendly format
Printer-friendly format Email this thread to a friend
Printer-friendly format Bookmark this thread
This topic is archived.
Home » Discuss » Topic Forums » Environment/Energy Donate to DU
 
CabalPowered Donating Member (1000+ posts) Send PM | Profile | Ignore Tue May-08-07 04:12 PM
Original message
Significant warming event over Antarctica
I occasionally check the temperature anomaly maps from NOAA. I about fell out of my chair when I pulled up the current 7 day temp map.


That's more than an 18 degree Celsius increase in temp, over historical means.

Printer Friendly | Permalink |  | Top
Richard D Donating Member (1000+ posts) Send PM | Profile | Ignore Tue May-08-07 04:20 PM
Response to Original message
1. That gives a whole new level of meaning . . .
. . . to the oft overused phrases: "That's really fucking scary." and "looks like we're screwn"
Printer Friendly | Permalink |  | Top
 
Dogmudgeon Donating Member (1000+ posts) Send PM | Profile | Ignore Tue May-08-07 04:22 PM
Response to Original message
2. It's mid-autumn there, too
And you may have overlooked a detail: the temperature anomaly is based on temperatures from 1985-1996, already in the warming cycle.

Last autumn, the Arctic was running warm, by maybe 3-5°C. But 18°C is an entirely larger order of magnitude.

I still think this is one of the temperature spikes before an Heinrich Event; that sometime in the next 10-100 years, there is a good chance that we will have more of these spikes and the climate will drop into something like the cooling phase of the Younger-Dryas period. But, of course, I have no certainty in saying this. A considerable amount of the warming is anthropogenic, so this may be nothing like the climatic instability seen before a natural Heinrich or Dansgaard-Oeschger event.

Next concern: We can survive something like this. But will we? "Just-in-time" responses may actually be 20 years too late.

I have waaay more questions than I even have guesses.

--p!
Printer Friendly | Permalink |  | Top
 
XemaSab Donating Member (1000+ posts) Send PM | Profile | Ignore Thu Jul-19-07 08:30 PM
Response to Reply #2
45. Not quite...
It's the dead of winter.

The summer solstice here was a month ago. Austral Midwinter would have been a month ago there. Considering that the hottest and coldest temperatures lag behind the solstices, they should still be getting colder. They were darkest, however, on the 21st of June.

Printer Friendly | Permalink |  | Top
 
XemaSab Donating Member (1000+ posts) Send PM | Profile | Ignore Thu Jul-19-07 08:31 PM
Response to Reply #2
46. Oh wait, I am a doofus!
Forgot to look at the date of the post.
Printer Friendly | Permalink |  | Top
 
doublethink Donating Member (1000+ posts) Send PM | Profile | Ignore Tue May-08-07 04:24 PM
Response to Original message
3. Rut Roww ......
we're screwn.
Printer Friendly | Permalink |  | Top
 
hatrack Donating Member (1000+ posts) Send PM | Profile | Ignore Tue May-08-07 04:38 PM
Response to Original message
4. Could this be an instrumental error?
Edited on Tue May-08-07 04:38 PM by hatrack
Because if it isn't, that's really bizarre.

+18 Celsius? Damn!

Of course, I wondered if that gigantic hole opening in the ice in the Beaufort Sea last summer could be an artifact of satellite imaging. It wasn't.
Printer Friendly | Permalink |  | Top
 
CabalPowered Donating Member (1000+ posts) Send PM | Profile | Ignore Tue May-08-07 05:04 PM
Response to Reply #4
11. Maybe, I don't think so. Today's 1-day map looks worse
Edited on Tue May-08-07 05:05 PM by CabalPowered
1 day temp anomaly..


and then 90 day..

Printer Friendly | Permalink |  | Top
 
philb Donating Member (1000+ posts) Send PM | Profile | Ignore Sun May-13-07 09:29 AM
Response to Reply #11
35. What is the URL for this?
Printer Friendly | Permalink |  | Top
 
CabalPowered Donating Member (1000+ posts) Send PM | Profile | Ignore Sun May-13-07 02:00 PM
Response to Reply #35
36. All anomaly maps here
http://geography.uoregon.edu/weather/#ClimateAnomalyMaps&Diagrams

I think there's a link to the NOAA directory somewhere down thread.
Printer Friendly | Permalink |  | Top
 
phantom power Donating Member (1000+ posts) Send PM | Profile | Ignore Tue May-08-07 04:40 PM
Response to Original message
5. Wow. The entire continent. Looks like it might have saturated the scale too.
As in, the actual temps are even higher than displayed.
Printer Friendly | Permalink |  | Top
 
kimmerspixelated Donating Member (1000+ posts) Send PM | Profile | Ignore Tue May-08-07 04:43 PM
Response to Original message
6. This could set off the Day After Tomorrow scenario.
Everyone would be headed to South Texas or Mexico.
Printer Friendly | Permalink |  | Top
 
phantom power Donating Member (1000+ posts) Send PM | Profile | Ignore Tue May-08-07 04:45 PM
Response to Reply #6
7. Wrong pole for that.
Although a melting event in Antarctica might affect the southern currents in new and exciting ways. Assuming this anomaly puts the temperature above melting point. And assuming the whole thing isn't instrument error, ht hatrack.
Printer Friendly | Permalink |  | Top
 
OKIsItJustMe Donating Member (1000+ posts) Send PM | Profile | Ignore Tue May-08-07 04:52 PM
Response to Original message
8. Where do you find these anomaly maps?
I've searched the NOAA site, and I can't find 'em.
Printer Friendly | Permalink |  | Top
 
CabalPowered Donating Member (1000+ posts) Send PM | Profile | Ignore Tue May-08-07 05:01 PM
Response to Reply #8
10. You know I'm not sure how to find the directory at NOAA
Edited on Tue May-08-07 05:02 PM by CabalPowered
I access them from here..

http://geography.uoregon.edu/weather/#ClimateAnomalyMaps&Diagrams

edit for better link
Printer Friendly | Permalink |  | Top
 
OKIsItJustMe Donating Member (1000+ posts) Send PM | Profile | Ignore Wed May-09-07 05:56 PM
Response to Reply #10
24. Thanks
Edited on Wed May-09-07 06:07 PM by OKIsItJustMe
I couldn't find it at NOAA for the life of me!

The one month trend doesn't look much better to me!
Printer Friendly | Permalink |  | Top
 
bananas Donating Member (1000+ posts) Send PM | Profile | Ignore Wed May-09-07 02:04 AM
Response to Reply #8
19. here
Edited on Wed May-09-07 02:07 AM by bananas
Printer Friendly | Permalink |  | Top
 
kestrel91316 Donating Member (1000+ posts) Send PM | Profile | Ignore Tue May-08-07 04:57 PM
Response to Original message
9. Tell me again how much sea levels will rise if Greenland AND all of
Antarctica melt??

100 ft+???
Printer Friendly | Permalink |  | Top
 
phantom power Donating Member (1000+ posts) Send PM | Profile | Ignore Tue May-08-07 05:15 PM
Response to Reply #9
12. If *everything* melts, it's over 200 feet.
Printer Friendly | Permalink |  | Top
 
kestrel91316 Donating Member (1000+ posts) Send PM | Profile | Ignore Tue May-08-07 06:34 PM
Response to Reply #12
15. I'll make a point of remembering that, and making my residential
real estate investment choices accordingly.
Printer Friendly | Permalink |  | Top
 
july302001 Donating Member (175 posts) Send PM | Profile | Ignore Tue May-08-07 11:01 PM
Response to Reply #15
17. but mowing those hills....LOL
Oh, but mowing the lawn on flat ground down in Daytona or Tampa is soooo much easier than these d*nged SLOPES up here in the hills!!! :sarcasm:
Printer Friendly | Permalink |  | Top
 
krkaufman Donating Member (1000+ posts) Send PM | Profile | Ignore Tue May-08-07 11:37 PM
Response to Reply #15
18. Yeah. And I thought I could never afford beachfront property.
Like * says, climate change offers us new opportunities, like the extended growing season in the North.
Printer Friendly | Permalink |  | Top
 
hatrack Donating Member (1000+ posts) Send PM | Profile | Ignore Tue May-08-07 05:15 PM
Response to Reply #9
13. No, more like 200 - 250 nt
.
Printer Friendly | Permalink |  | Top
 
smirkymonkey Donating Member (1000+ posts) Send PM | Profile | Ignore Fri May-11-07 09:35 AM
Response to Reply #13
32. Does anyone have that map that shows the new coastline
under 200-250 feet of water? We used to see it around here regularly.
Printer Friendly | Permalink |  | Top
 
happyslug Donating Member (1000+ posts) Send PM | Profile | Ignore Thu Jul-19-07 06:03 PM
Response to Reply #9
44. But East Antarctic Ice Sheet is NOT expected to melt.
And even with this temperature, the East Antarctic Ice Sheet (EAIS) is considered Stable. 70% of fresh water in the world is stored in the EAIS. The EAIS is completely within the Antarctic Circle AND is located on the HIGHEST Continent on the earth (Antarctica is on average HIGHER than all the other Continents, Asia and South America has much taller mountains, but also have huge plains that are closer to mean sea level than Antarctica).

The real concern is the WEST Antarctic Ice Sheet (WAIS). WAIS contains about 12% of the world fresh water (and can raise world wide Sea levels 15-20 feet). WAIS is groined BELOW sea level and as such world wide ocean temperature has a GREAT affect on it by just bring warmer water in contact with it. WAIS is sometime called the Godzilla of Global Warming. It is possible for the WAIS to collapse overnight (Probably around the march 21s, the first day of Autumn in the SOuthern Hemisphere, thus after it has been exposed to the greatest amount of WARMTH possible). Just before the last Ice Age it is believe it did collapse, raising world wide sea levels 20 feet (And within 100 years of that date, maybe 50 years, the ice age was going on full speed with a DROP in world wide sea levels by 200 feet as more and more water was in the form of Glaciers as their expanded).

More on the "Mad-House Century" of 120,000 years ago:
http://www.imaja.com/as/environment/can/journal/madhousecentury.html

My theory on what happen 120,000 years ago is do to global warming the WAIS collapsed and raised world wide sea levels 20 feet. This collapse also opened up iron and other trace deposits to get not only into the Southern Ocean (The Ocean that Surround Antarctica) but also the Southern Pacific and Indian Oceans. Right now these two areas are ocean deserts. While they get plenty of sunligth, no plankton thrive there. Most Scientists believes the reason why no plankton is that the plankton closer to the other continents consume all of the Iron and other trace material plankton need to live. Thus the comment that given a steady source of iron and other trace material, the Southern Pacific and Indian oceans would BLOOM with plankton. This would also fix Carbon Dioxide so much that the world wide temperature would DROP and caused the Ice Age. This is one of many theories on what cause the ICe Age, but it explains the RAPID raise in world wide Sea levels followed QUICKLY by a DROP in WOrld Wide Sea levels. Furthermore it is now believed that the world has "Trigger Points" that once hit things change, but until those points are hit, things stay the same. For the last 10,000 years we have had a very stable climate do to the fact that the world warmed up as the last Ice Age ended. Thus what we are doing to the Climate may be worse then we can even image, given the tendency for this plant to have some sort of stable environment, be it permanent Ice or lack of ice.
Printer Friendly | Permalink |  | Top
 
Morgana LaFey Donating Member (1000+ posts) Send PM | Profile | Ignore Tue May-08-07 06:25 PM
Response to Original message
14. Okay, either someone tell me the temps in Fahrenheit, or where's
that damn conversion formula? (I HATE Celsius!)
Printer Friendly | Permalink |  | Top
 
muriel_volestrangler Donating Member (1000+ posts) Send PM | Profile | Ignore Wed May-09-07 08:15 AM
Response to Reply #14
22. For temperature changes or anomalies:
to go from Celsius (or Kelvin) to Fahrenheit: multiply by 9, and divide by 5

So an 18 degree Celsius increase is a 32.4 degrees Fahrenheit increase.

For a single Celsius temperature: multiply by 9, and divide by 5, and then add 32.

So 15 degrees Celsius is 59 degrees Fahrenheit.
Printer Friendly | Permalink |  | Top
 
Morgana LaFey Donating Member (1000+ posts) Send PM | Profile | Ignore Wed May-09-07 08:37 PM
Response to Reply #22
25. "So 15 degrees Celsius is 59 degrees Fahrenheit."
In that case: HOLY SHIT!!!!!

Thanks.
Printer Friendly | Permalink |  | Top
 
muriel_volestrangler Donating Member (1000+ posts) Send PM | Profile | Ignore Thu May-10-07 07:08 AM
Response to Reply #25
28. Hang on - you should be looking at the *increase* figure for what we're talking about now
ie "an 18 degree Celsius increase is a 32.4 degrees Fahrenheit increase"

Saying "15 degrees Celsius is 59 degrees Fahrenheit" is no more worrying than pointing out that 0 degrees Celsius is 32 degrees Fahrenheit. It's just a statement of fact (perhaps I should have selected another example with number far away from the anomaly figures in the map, like "100 degrees Celsius is 212 degrees Fahrenheit").

The anomalies in the Antarctic are a comparison between 2 temperatures - like a change, or an increase. So the maximum anomaly shown on the map is 18 degrees Celsius - that is, 32.4 degrees Fahrenheit. Still worrying, but the thing the map shows is that, over a week, much of Antarctica was at least 32 degrees Fahrenheit warmer than average for this time of year (which may mean, say, it was -20 Fahrenheit instead of -52 Fahrenheit).
Printer Friendly | Permalink |  | Top
 
Morgana LaFey Donating Member (1000+ posts) Send PM | Profile | Ignore Thu May-10-07 08:53 PM
Response to Reply #28
29. Here's what I was reacting to
The graph and legend in the OP shows up to 18 degrees Celsius in parts of Antacrtica. If that's 59 or more degrees, it seems to me that's a LOT for Antarctica. I don't much care about any of what you're saying because that's not what I was reacting to.

See?

Now, if I'm wrong about the 59 degrees Farhenheit in the Antarctica, please point out to me how.
Printer Friendly | Permalink |  | Top
 
Systematic Chaos Donating Member (1000+ posts) Send PM | Profile | Ignore Thu May-10-07 11:40 PM
Response to Reply #29
30. If the normal temperature in a given location is 27F right now...
...then yes, if it's elevated by 18C or 32F then it would be 59 instead. At places near the coast and beyond the Antarctic Circle, this may be possible this time of year but I doubt it.

More likely that a normal temperature of 0F is registering as 32F instead. Still pretty damn warm for there when it's mostly dark now.
Printer Friendly | Permalink |  | Top
 
muriel_volestrangler Donating Member (1000+ posts) Send PM | Profile | Ignore Fri May-11-07 03:44 AM
Response to Reply #29
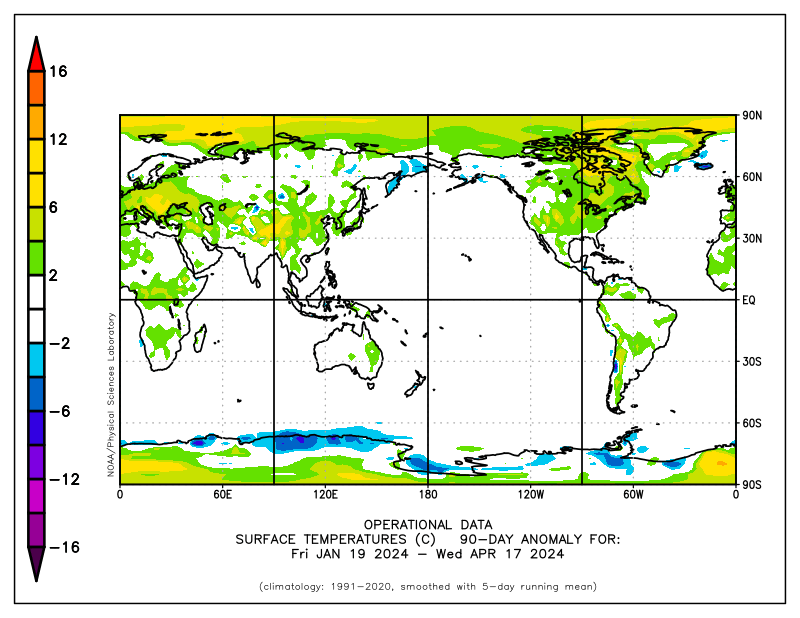
31. The graph in the OP shows temperature *increases* over their normal values
It's saying the temperatures is 18 degrees Celsius *warmer* than normal (for this time of year) in Antarctica. Compare that with the section of north-west Africa, say, in light blue, which shows between 3 and 6 degrees Celsius colder than normal for the week.

So Antarctica was 18 degrees Celsius warmer - or 32 degrees Fahrenheit warmer. That's still hugely worrying, of course, but "32 degrees Fahrenheit warmer" is the message from the map. The vast majority of Antarctica is still well below freezing - it can be hard to remember just how cold the place mostly is. Here the equivalent map such the actual temperatures for the same period:


That does show, for instance, a section of the Antarctic coast at about 90 degrees west, which is at about -5 degrees Celsius (ie 23 degrees Fahrenheit) when its normal temperature would be -20 degrees Celsius (ie -4 degrees Fahrenheit). Far inland, it's still below -40 degrees Celsius (which happens to be -40 degrees Fahrenheit) - but its normal temperature would be more like -60 degrees Celsius.
Printer Friendly | Permalink |  | Top
 
Morgana LaFey Donating Member (1000+ posts) Send PM | Profile | Ignore Fri May-11-07 11:17 PM
Response to Reply #31
33. Ah, okay
I think I've got it. Thanks.
Printer Friendly | Permalink |  | Top
 
Dogmudgeon Donating Member (1000+ posts) Send PM | Profile | Ignore Wed May-09-07 10:40 PM
Response to Reply #22
26. Oops.
Edited on Wed May-09-07 10:40 PM by Pigwidgeon
--p!
Printer Friendly | Permalink |  | Top
 
Odin2005 Donating Member (1000+ posts) Send PM | Profile | Ignore Tue May-08-07 06:56 PM
Response to Original message
16. That is fucking bizarre!
:wtf:
Printer Friendly | Permalink |  | Top
 
Dead_Parrot Donating Member (1000+ posts) Send PM | Profile | Ignore Wed May-09-07 06:14 AM
Response to Original message
20. OFHWAD...
I really hope there's an explanation for the, err, anomaly which doesn't involve the temperature in Antarctica going up by ~20o.

'Cause that's some scary shit.
Printer Friendly | Permalink |  | Top
 
Nihil Donating Member (1000+ posts) Send PM | Profile | Ignore Wed May-09-07 07:29 AM
Response to Original message
21. Whilst the mean temperature is still comfortably low ...
... the magnitude of the anomaly suggests either a system error (I hope!)
or something *REALLY* bad ...

There again, although it's showing -30 or lower for most of the inland area,
I'm a bit concerned that the edge of the WAIS is looking "warm" ?

(BTW, thanks Bananas for your link to the NOAA charts in #19!)
Printer Friendly | Permalink |  | Top
 
muriel_volestrangler Donating Member (1000+ posts) Send PM | Profile | Ignore Wed May-09-07 08:38 AM
Response to Reply #21
23. Yes - the 180 day chart (ie the past 'summer') shows about +2 degrees difference
in the Amundsen and Ross Sea areas - which, with salt water, would mean significant melting of sea ice in the 0 to -5 degree range round there. That on its own doesn't raise sea levels, but it could expose the glacier mouths so they discharge a lot quicker ...
Printer Friendly | Permalink |  | Top
 
Nihil Donating Member (1000+ posts) Send PM | Profile | Ignore Thu May-10-07 06:56 AM
Response to Original message
27. Has anyone heard an explanation, retraction or anything yet?
I'd quite like to hear the authorities saying something like "Ah, we're sorry
to have concerned you folks but this was a glitch in the automatic system"
or even "Don't worry - what you need to bear in mind is ..."

Anyone?

Please?

:scared:
Printer Friendly | Permalink |  | Top
 
Systematic Chaos Donating Member (1000+ posts) Send PM | Profile | Ignore Sat May-12-07 04:37 AM
Response to Original message
34. Have you all noticed yet that the link is updating automatically?
This is NO anomaly in terms of measurements, people. This is the real McCoy, and I think it sets the stage for a MASSIVE sea level rise which will occur soon and with extreme suddenness. I want so much to be wrong but the nightmare which prompted this feeling of mine was just too damn real.

This is one of those times I want nothing more than to be proven dead wrong, and I usually hate being wrong....
Printer Friendly | Permalink |  | Top
 
Dogmudgeon Donating Member (1000+ posts) Send PM | Profile | Ignore Thu May-24-07 09:13 PM
Response to Reply #34
38. A similar anomaly possibly started the Younger-Dryas
A huge ice lake, similar to the one that has formed in Antarctica, formed on the Laurentian Ice Sheet. When it broke through, it greatly disturbed several thermohaline currents, and the episode is thought to have triggered the Younger-Dryas global cooling period.

Of course, this is just one similar phenomenon, we don't know much about it, most of the details are conjectural, and the current climate change is NOT entirely natural. But we would be wise to fear this icelocked lake, in the event it were to break through to the ocean. The Antarctic is surrounded by what has come to be called "The Southern Ocean", which itself is a major regulator of temperature, carbon gas balance, and other natural macro-processes. If it were to suddenly dump, it would be an epochal event.

Did I say "epochal"? I meant to say "terrifying".

--p!
Printer Friendly | Permalink |  | Top
 
highplainsdem Donating Member (1000+ posts) Send PM | Profile | Ignore Thu May-24-07 08:00 PM
Response to Original message
37. Kicking, since the anomaly is continuing.
And the 1-day map for 5/24 is showing some areas that are more than 20 degrees C. warmer.
Printer Friendly | Permalink |  | Top
 
muriel_volestrangler Donating Member (1000+ posts) Send PM | Profile | Ignore Fri May-25-07 05:35 AM
Response to Reply #37
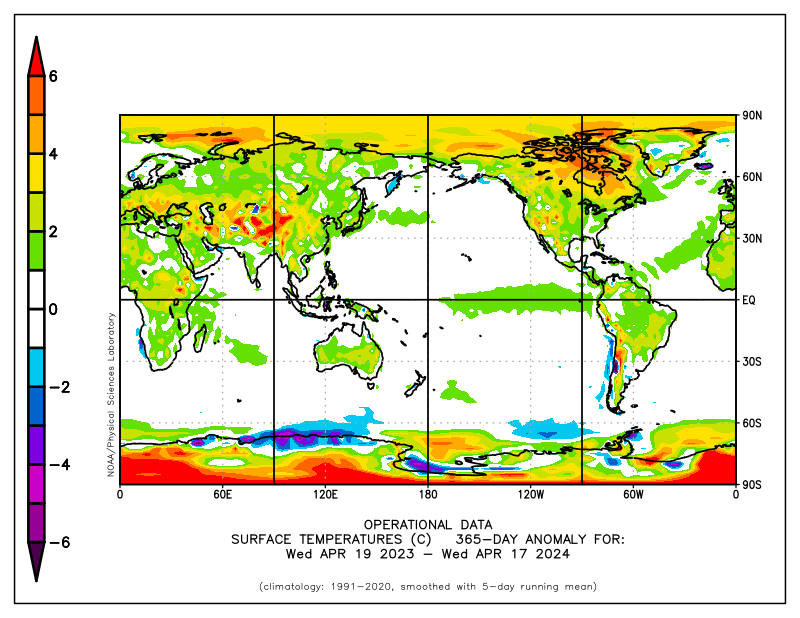
39. The anomaly for *a whole year* is more than 8 degrees C


And that's both in an inland area, and the Ross Ice Shelf. That's ice which is already pretty warm - it doesn't take much warming to get it to melt. Part of the melting/refreezing that happened in '05 was the landward side of the Ross Ice Shelf:


(the Ross Ice Shelf is the area at the centre bottom - the diagonal area of melting in the centre of the picture is where it meets true land)

The areas included a vast stretch of the Ross Ice Shelf abutting the Transantarctic Mountain range. That shelf is the size of Texas and would lead to major glacier flows into the ocean were it to collapse.

That melt area is right at the border between the ice shelf and the mountain, it's kind of like a hinge," study co-leader Son Nghiem of NASA's Jet Propulsion Laboratory in Pasadena, Calif., told msnbc.com. "If that hinge is weakened it might have a dynamic effect on the ice shelf. It's still a hypothesis, but it's something we have to look into."

http://www.msnbc.msn.com/id/18698596/
Printer Friendly | Permalink |  | Top
 
highplainsdem Donating Member (1000+ posts) Send PM | Profile | Ignore Sun Jul-15-07 11:23 PM
Response to Original message
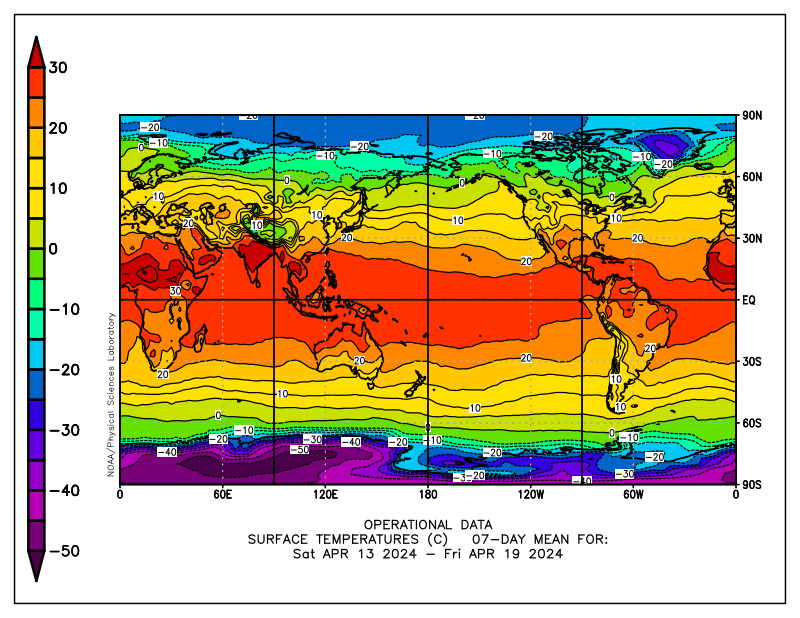
40. Look at the 1-day anomaly map in reply 11.
Today, and for the last couple of days, it's been showing very large areas of unusually cold ocean surface off very large areas of unusually warm Antarctic surface.

I've been checking this topic occasionally since it was first posted, and this is the first time I've seen that pattern.
Printer Friendly | Permalink |  | Top
 
highplainsdem Donating Member (1000+ posts) Send PM | Profile | Ignore Mon Jul-16-07 09:26 AM
Response to Reply #40
41. Can anyone tell me if that pattern, the one I mentioned yesterday,
could indicate much more rapid warming of the Ross Ice Shelf? I know scientists have been concerned about a possible collapse, and Sea Shepherd visited the area last year.

Maybe this is a pattern that shows up fairly often, but as I said in yesterday's post, I really don't recall seeing it on the anomaly maps until just the last few days.
Printer Friendly | Permalink |  | Top
 
CabalPowered Donating Member (1000+ posts) Send PM | Profile | Ignore Mon Jul-16-07 11:48 AM
Response to Reply #41
42. It's possible but I think some of what you're seeing is a byproduct
of the map projection. I can't remember the specific name of this projection, but it increases the relative size of the poles. Technically, the anomaly map that you refer to should include temp data for only land surfaces. So where you see anomaly over sea water that is near land, it's most likely a difference in map projections. Another map that is worth looking in regards to your question would be this one..

Printer Friendly | Permalink |  | Top
 
highplainsdem Donating Member (1000+ posts) Send PM | Profile | Ignore Wed Jul-18-07 03:00 PM
Response to Reply #42
43. Thanks for the reply! I was concerned because stories on
Edited on Wed Jul-18-07 03:03 PM by highplainsdem
Sea Shepherd's investigation late last year mentioned tsunami risks if the ice shelf collapses.

The temperature anomaly there seems to be continuing.
Printer Friendly | Permalink |  | Top
 
RestoreGore Donating Member (1000+ posts) Send PM | Profile | Ignore Fri Jul-20-07 05:45 AM
Response to Original message
47. The Gulf Stream is also slowing down and that is not good
This is very disconcerting, and proves that when al Gore and scientists say that this planet is in danger, it is. But hell, Flat Earthers can't read maps and graphs anyway, the fools.
Printer Friendly | Permalink |  | Top
 
Systematic Chaos Donating Member (1000+ posts) Send PM | Profile | Ignore Fri Jul-20-07 05:54 PM
Response to Original message
48. Kicking because this thread has more info than mine.
And the Western US continues to swelter. :cry:
Printer Friendly | Permalink |  | Top
 
tom_paine Donating Member (1000+ posts) Send PM | Profile | Ignore Sat Jul-21-07 06:09 AM
Response to Original message
49. Thanks for the excellent information! Bookmarked! KICK!
:kick:
Printer Friendly | Permalink |  | Top
 
highplainsdem Donating Member (1000+ posts) Send PM | Profile | Ignore Tue Sep-04-07 09:43 PM
Response to Original message
50. What happened to the anomaly maps?
I've been checking them now for months, and this is the first time any of them were replaced by maps with no info that read "Entire Grid Undefined."

I checked out the web page those maps are from, too, at

http://geography.uoregon.edu/weather/#ClimateAnomalyMaps&Diagrams

and discovered that the mean as well as the anomaly maps are missing, except for the one-day maps.

I was planning to bump this topic soon anyway, for that link and the maps. And because the unusually high temps over the Ross Ice Shelf are continuing. I didn't want the topic to disappear into the archives.

Now I'm wondering why those maps would vanish. I hope that information is back soon.
Printer Friendly | Permalink |  | Top
 
happyslug Donating Member (1000+ posts) Send PM | Profile | Ignore Tue Sep-04-07 10:06 PM
Response to Reply #50
51. The site derived its maps from NOAA, which apparently dropped anomaly map
Edited on Tue Sep-04-07 10:12 PM by happyslug
Why, I do NOT know, but I suspect someone is the White House did NOT like the results and ordered them taken down as "No based on Science". Remember, while the present temperatures are accurate and widespread, the historical records, while accurate, are from a much smaller number of sites. Thus you can argue that you should NOT compare today's data with historical Data.

Now, anybody who looks at the numbers can solve this "problem" easily, but just comparing number from sites that have been around 30-40 years. But that is a much smaller number of sites for temperatures and thus NOT accurate for world wide temperature variations (I do NOT believe this, I am thinking of how people can attack the making of temperatures anomaly maps).

I suspect the maps were removed for Political reasons, someone did NOT want these maps to be published. Who I dod not know, but The maps have been pulled.

Please note the "Sea Surface" anomaly map is still active in the 90 day list.
Printer Friendly | Permalink |  | Top
 
highplainsdem Donating Member (1000+ posts) Send PM | Profile | Ignore Tue Sep-04-07 10:18 PM
Response to Reply #51
52. That's my guess, too -- they were pulled for political reasons.
This is the link for the NOAA map room page, which I found just minutes ago

http://www.cdc.noaa.gov/map/

and under Climate Products they do have a link for Sea Surface Temperatures

http://www.cdc.noaa.gov/map/clim/sst.shtml

and that includes SST anomalies for the last week, month, and season (corresponding to the old 90-day map, apparently).

But I haven't been able to find surface temp and surface wind maps.

I did notice this statement at the top of the current map room page:

These graphical products are not guaranteed to be updated on a regular basis. They are intended to serve as examples of our ongoing work.

Anyone know if that statement is recent, or if that was there all during the time they were providing the maps and updating them regularly?


By the way, the links for the maps have all been changed from what they were on that University of Oregon page. Clicking on them takes you straight to the new page, with the blank maps for so many of them.
Printer Friendly | Permalink |  | Top
 
Dead_Parrot Donating Member (1000+ posts) Send PM | Profile | Ignore Wed Sep-05-07 12:51 AM
Response to Reply #52
53. It's been there a while
http://web.archive.org/web/20000815070810/http://www.cdc.noaa.gov/map/ is the earliest archive on file (Aug 15, 2000) and it carries the same disclaimer.
Printer Friendly | Permalink |  | Top
 
highplainsdem Donating Member (1000+ posts) Send PM | Profile | Ignore Wed Sep-05-07 08:23 AM
Response to Reply #53
54. Thanks!
It hadn't occurred to me to check that website. I had found a Google cache of the page but it was less than a week old.

I see that main map room page had a link only to the sea suface temp map page even in 2000, so they haven't removed a link to a page with surface temp maps.

I still haven't found anything on the site to provide a different link to maps showing the surface temps, the mean temp and anomalies over longer periods that just one day. I'm still hoping those maps will eventually be replaced and will work through the links on that University of Oregon page and reappear in this topic, if there is just some updating of the site going on and they haven't decided to withhold that information.

With the Arctic sea ice vanishing much faster than scientists expected, having temps on the Ross Ice Shelf at least 20 degrees Centigrade above normal becomes more and more worrisome. The one-day map of mean temperatures yesterday seemed to show much of the shelf not that far below 0 Centigrade, so it might be above freezing part of the day.
Printer Friendly | Permalink |  | Top
 
macllyr Donating Member (72 posts) Send PM | Profile | Ignore Wed Sep-05-07 09:58 AM
Response to Reply #54
55. the maps are still there
I don't understand.

The surface temp maps are still available as "reanalyzed" data there :
www.cdc.noaa.gov/map/clim/glbcir.quick.shtml

There is a ST animation map available for the past year (Nov 06 - Jun 07) there:
www.cdc.noaa.gov/map/images/fnl/sfctmpmer_90a.fnl.anim.html

The temperature anomaly in mainland antartica is evident (+12° celsius)

Macl'lyr
Printer Friendly | Permalink |  | Top
 
highplainsdem Donating Member (1000+ posts) Send PM | Profile | Ignore Wed Sep-05-07 10:25 PM
Response to Reply #55
58. Thanks again, Mac L'lyr!
I replied to your post in the LBN topic about Arctic sea ice melting, too:

http://www.democraticunderground.com/discuss/duboard.php?az=view_all&address=102x2977668

As I said there, I can find regular one-day maps now, via those links, but to find the older data I need to check the animated maps. The links we've been using don't work, and most of the maps shown in this topic now are blank, showing just the globe and that text about the grid being undefined, but no climate info.

I hope this just means NOAA is partway through some revamping of their site and eventually we'll be able to look at one-week and older data without checking the animated maps. But it might mean the URLs used for most of the maps in this topic (as well as that University of Oregon page) will have to be changed.


By the way, Mac L'lyr, I said in my reply in that LBN topic that the first of the two links you posted didn't work. It does in this post. Here you have the link ending in shtml. In the LBN post it ended in shtm. I hadn't been aware that was the problem with the link when I posted the reply there.
Printer Friendly | Permalink |  | Top
 
muriel_volestrangler Donating Member (1000+ posts) Send PM | Profile | Ignore Thu Sep-06-07 09:43 AM
Response to Reply #55
59. Wow - more than +8 degrees C anomaly, over 90 days, for a lot of the Ross Ice Shelf
and Ross Sea - see http://www.cdc.noaa.gov/map/images/rnl/sfctmpmer_90a.rnl.html

Still well below freezing in the centre of it, but you have to wonder what happened to the formation of sea ice at its edge, which should have been happening in the depth of the Antarctic winter.
Printer Friendly | Permalink |  | Top
 
philb Donating Member (1000+ posts) Send PM | Profile | Ignore Wed Sep-05-07 09:57 PM
Response to Reply #51
57. NOAA also appears to have dropped daily surface temp postings at NOAA coastal buoys
Apparently they don't want the public to know that the ocean temperatures are increasing.

But I have a summary of about 100 of the buoy site temperature change over the last 30 years. Temp increasing rapidly, with larger increases in northern sites like Great Lakes and Alaska, etc. than in the Gulf. But increasing everywhere.

www.flcv.com/sitesum.html

Printer Friendly | Permalink |  | Top
 
CabalPowered Donating Member (1000+ posts) Send PM | Profile | Ignore Wed Sep-05-07 12:57 PM
Response to Reply #50
56. Most likely a sattelite disruption
I haven't seen these errors on the anomaly maps but I have seen them on the short term ETA and GFS forecasts which are up a 1/4 page on the U of O link. Since the map is derived of a 7 day rolling average, the simulation probably errors if one day in seven is missing data. Which also means that the 30 day and 90 day maps will be off until the bad data passes through the simulation.

:(
Printer Friendly | Permalink |  | Top
 
DU AdBot (1000+ posts) Click to send private message to this author Click to view 
this author's profile Click to add 
this author to your buddy list Click to add 
this author to your Ignore list Fri Apr 19th 2024, 08:06 PM
Response to Original message
Advertisements [?]
 Top

Home » Discuss » Topic Forums » Environment/Energy Donate to DU

Powered by DCForum+ Version 1.1 Copyright 1997-2002 DCScripts.com
Software has been extensively modified by the DU administrators


Important Notices: By participating on this discussion board, visitors agree to abide by the rules outlined on our Rules page. Messages posted on the Democratic Underground Discussion Forums are the opinions of the individuals who post them, and do not necessarily represent the opinions of Democratic Underground, LLC.

Home  |  Discussion Forums  |  Journals |  Store  |  Donate

About DU  |  Contact Us  |  Privacy Policy

Got a message for Democratic Underground? Click here to send us a message.

© 2001 - 2011 Democratic Underground, LLC