EDIT
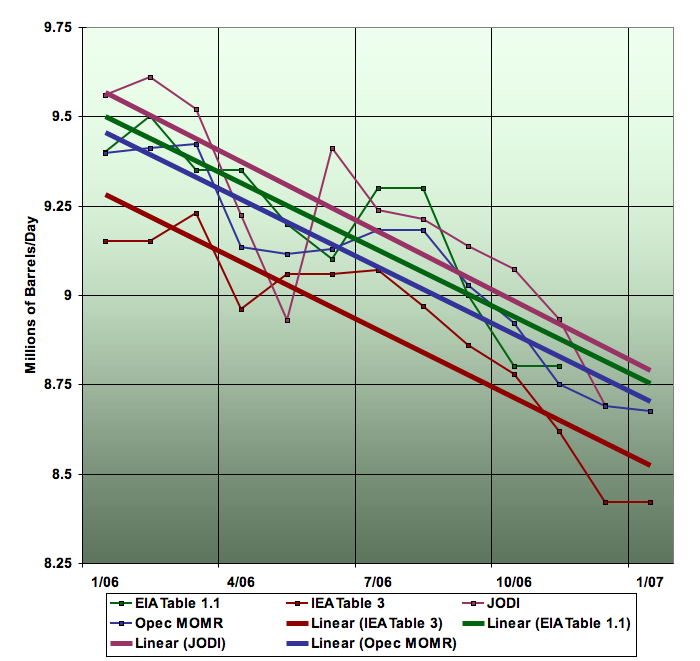
Saudi Arabian oil production, Jan 2006-Jan 2007, from four different sources. Linear trends fitted to each series. Graph is not zero-scaled to better show changes. Click to enlarge. Source: US EIA International Petroleum Monthly Table 1.1, IEA Oil Market Report Table 3, Joint Oil Data Initiative, OPEC Monthly Oil Market Report, Table 17 (or similar) on OPEC Supply.
For a talk I was meant to give, I updated my graphs of Saudi oil production, which I hadn't done in a few months. What I found was pretty interesting, and I'm starting to draw stronger conclusions. Last time I looked at this, I made an earlier version of this graph:
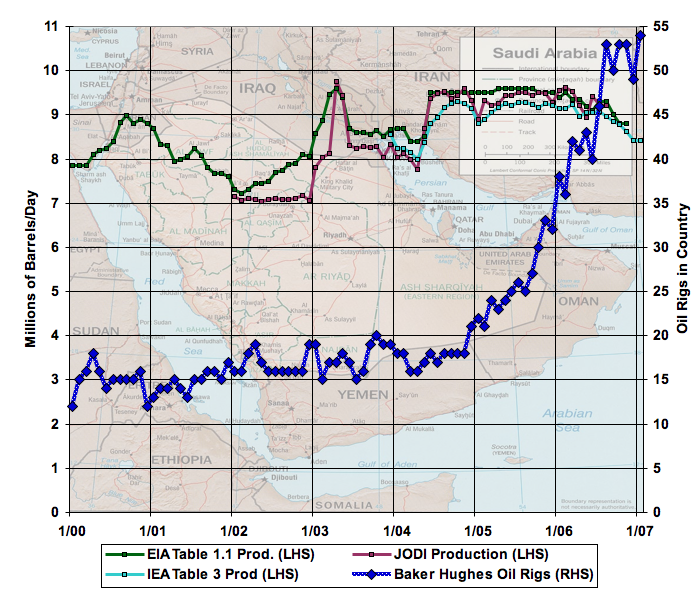
Saudi Arabian oil production (left scale) and oil rigs in country (right scale), Jan 2000-Jan 2007. Click to enlarge. Source: US EIA International Petroleum Monthly Table 1.1, IEA Oil Market Report Table 3, and Joint Oil Data Initiative for oil supply. Baker Hughes for rig counts.
At that time, while the conjunction of declining production and rising rig counts was striking, I wasn't ready to draw firm conclusions on the data through August-October (depending on agency). Recently, Jim Hamilton raised the same questions:
The first possibility is that the Saudis could still pump 10 mbd or more today if they wanted to, but they are cutting back production and exploring like mad because they put an extremely high value on having 2-3 mbd of excess capacity. If so, the recent price behavior suggests that the reason they would seek such capacity is not because they want to stabilize the price, but because it puts them in an incredibly powerful negotiating position. For example, the ability at any time to flood the market could be used at an opportune moment to undercut expensive alternatives such as oil sands that require an oil price over $50.
The second and more natural interpretation is even more disturbing: the mighty Ghawar oil field is already in decline, and the Saudis don't want anyone to know.
EDIT
The implied decline rate through the year is 8% � 0.1%. (Note that the year on year decline from 2005 to 2006 will only be about half that, as the decline only began at the beginning of 2006). As far as I know, there are no known accidents or problems that would explain any restrictions on oil supply, and the Saudis themselves have maintained publicly that their production is unproblematic and they intend to increase it.
It's interesting to note the pattern in the underlying data where declines start, are interrupted in the middle of the year, and then resume. I take this to be due to the coming onstream of the 300kbpd of liquids from the Haradh III megaproject:
HARADH, February 08, 2006 -- In a record 21 months from approval of funding, oil started flowing through the new Haradh gas-oil separation plant (GOSP) from several of 32 new wells that will feed the facility.
...
Full production will be attained by the new plant within the second quarter of 2006.
It seems this did not do more than briefly interrupt the declines. We can get a clearer picture as follows. What I did was average the EIA, IEA, and JODI series for 2005 and 2006 into a single estimate. Onto that, I've hand drawn a couple of guidelines that are 300 kbpd apart vertically:

Saudi Arabian oil production, Jan 2005-Jan 2007, from EIA, IEA, and JODI averaged together. Black lines are handplaced guidelines that are 300kbpd apart (the advertised capacity of Haradh III). Graph is not zero-scaled to better show changes. Click to enlarge. Source: US EIA International Petroleum Monthly Table 1.1, IEA Oil Market Report Table 3, and Joint Oil Data Initiative.
My intepretation is that the bump in the middle of the year that separates the two lines is due to the impact of Haradh III coming on stream. So that tells us that, given some extra production capacity, Saudi Aramco immediately threw it into the production mix. And the effect of that? It lifted the plummeting production curve up by 300kbpd, but did nothing to change the gradient of the plummet. That suggests that the Saudis had nothing else to throw at the problem.
It also suggests that last year's underlying Type II decline rate, before megaprojects like Haradh III, was 14%.
Overall, I feel this data is clear enough that I'm willing to go out on a limb and conclude the following:
Saudi Arabian oil production is now in decline.
The decline rate during the first year is very high (8%), akin to decline rates in other places developed with modern horizontal drilling techniques such as the North Sea.
Declines are rather unlikely to be arrested, and may well accelerate.
Matt Simmons appears to be right in Twilight in the Desert, but the warning did not come until after declines had actually begun.
EDIT
http://www.theoildrum.com/node/2325#more