Yesterday, August 6, the EIA published new International Petroleum Monthly data. The new data revised downward previously published estimates, all the way back to 2002, with the biggest revisions in 2007 and 2008. With the revisions, the latest month, May 2008, shows new record-high oil production. Other recent months which had previously set records are now 67,000 barrels per day to 417,000 barrels per day lower than reported just a month ago. In this post, I offer a few thoughts on what the new data suggests.
How Frequent are EIA Data Revisions
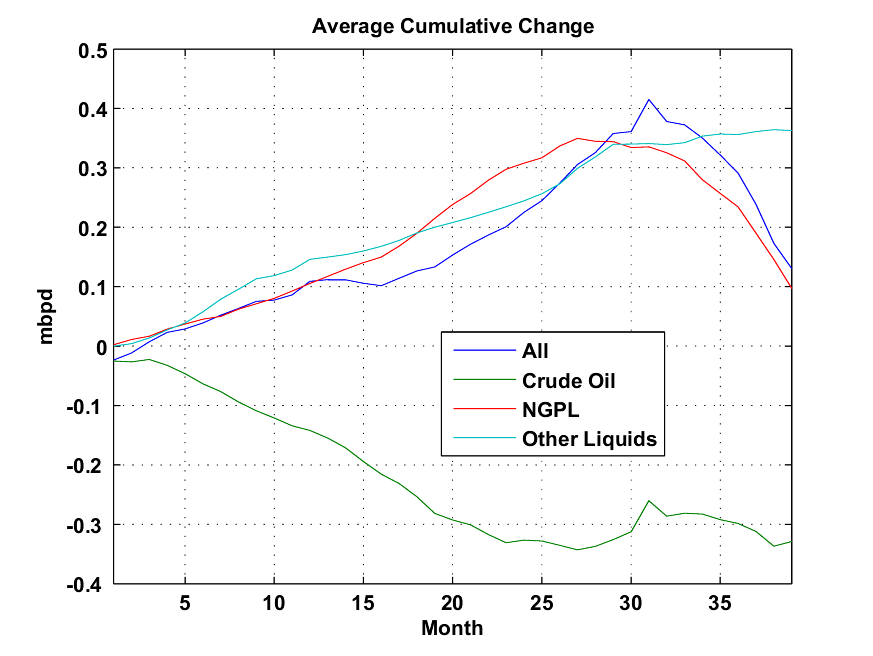
Khebab did an analysis of EIA data revisions back in October 2006. His analysis showed that at that time, crude estimates on average were revised down by about 300,000 barrels from their initial estimate. The downward revision took about three years. Estimates of other liquids tended to get revised upward over time. On a "total liquids" basis, one might expect some offset, since part is being adjusted upward and part downward.

Figure 2. Khebab's Chart showing average EIA revisions, based on 2006 data
Khebab made these estimates of expected bias in 2006. It is likely that they will change over time. One possible reason for such biases is the practice of estimating future production based on past production, if new numbers are not yet available. If production is declining, as is often the case with crude and condensate, there would tend to be a bias toward over-estimation. Also, if wells are taken off-line for maintenance, or because of a storm, using recent months production as an estimate will tend to miss these dips in production, also leading to overstatements.
Khebab's analysis showed that for portions of "All Liquids" other than crude and condensate, estimates tend to be revised upward. If we think about the matter, these liquids, such as ethanol, tend to be growing over time as a percentage of all liquids. If the same method is used for estimating these (using past months actuals to estimate the most recent month where production is unknown), it is not surprising that they will tend to be biased low, and show upward development over time. Since the "other" items tend to move in the opposite direction of crude and condensate, it is likely that there will be less bias in total liquids estimate than in the pieces.
In this analysis, we are really concerned with the crude portion, not the other items Khebab analyzed. If anything, we might expect crude estimates to be even more overstated in 2008 than 2006, because more countries are experiencing production declines.
One thing we can learn from the recent revisions and from Khebab's 2006 analysis is that we shouldn't put too much faith in the estimates for recent months. The crude and condensate estimate of 74.481 million barrels per day appears to be new record, but this is only 215,000 barrels higher than the record of 74.266 set in May 2005. If we estimate the expected downward revision at 300,000 barrels per day based on Khebab's analysis, the revised amount is expected to be less than the May 2005 record.
EDIT
http://www.theoildrum.com/node/4386#more