Welcome to DU!
The truly grassroots left-of-center political community where regular people, not algorithms, drive the discussions and set the standards.
Join the community:
Create a free account
Support DU (and get rid of ads!):
Become a Star Member
Latest Breaking News
General Discussion
The DU Lounge
All Forums
Issue Forums
Culture Forums
Alliance Forums
Region Forums
Support Forums
Help & Search
Environment & Energy
Related: About this forumPlant functional trait change across a warming tundra biome.
The paper from the primary scientific literature I will discuss briefly in this post is this one: Plant functional trait change across a warming tundra biome. (Anne D. Bjorkman et al Nature Volume 562, pages 57–62 (2018).
An excerpt from the introduction:
Rapid climate warming in Arctic and alpine regions is driving changes in the structure and composition of tundra ecosystems1,2, with potentially global consequences. Up to 50% of the world’s belowground carbon stocks are contained in permafrost soils3, and tundra regions are expected to contribute the majority of warming-induced soil carbon loss over the next century4. Plant traits strongly affect carbon cycling and the energy balance of the ecosystem, which can in turn influence regional and global climates5,6,7. Traits related to the resource economics spectrum8, such as specific leaf area (SLA), leaf nitrogen content and leaf dry matter content (LDMC), affect primary productivity, litter decomposability, soil carbon storage and nutrient cycling5,6,9,10, while size-related traits, such as leaf area and plant height, influence aboveground carbon storage, albedo (that is, surface reflectance) and hydrology11,12,13 (Extended Data Table 1). Quantifying the link between the environment and plant functional traits is therefore important to understanding the consequences of climate change, but such studies rarely extend into the tundra14,15,16. Thus, the full extent of the relationship between climate and plant traits in the coldest ecosystems on Earth has yet to be assessed, and the consequences of climate warming for functional change in the tundra remain largely unknown.
The "et al" in the author list here is rather large; this is the work of a large team of scientists, as the work demanded:
Here we quantify the biome-wide relationships between temperature, soil moisture and key traits that represent the foundation of plant form and function17, using a dataset of more than 56,000 tundra plant trait observations (Fig. 1a, Extended Data Fig. 1a and Supplementary Table 1). We examine five continuously distributed traits related to plant size (adult plant height and leaf area) and to resource economy (SLA, leaf nitrogen content and LDMC), as well as two categorical traits related to community-level structure (woodiness) and leaf phenology and lifespan (evergreenness). Intraspecific trait variability is thought to be especially important in regions where diversity is low or where species have wide geographical ranges18, as in the tundra. Thus, we analyse two underlying components of biogeographical patterns in the five continuous traits: intraspecific variability (phenotypic plasticity or genetic differences among populations) and community-level variability (species turnover or shifts in the abundances of species across space). We first investigated how plant traits vary with temperature and soil moisture across the tundra biome...
That's cool, scientists wandering across the tundra all over the world to make 56,000 measurements.
The paper is rather long, as one might expect, and regrettably it seems not to be open sourced. Someone who wishes to read it must either travel to a library or else take advantage of Nature's current quite reasonable (and wonderful) reduced price subscription offer which can be located on the internet. Here's some pictures from the paper, though:
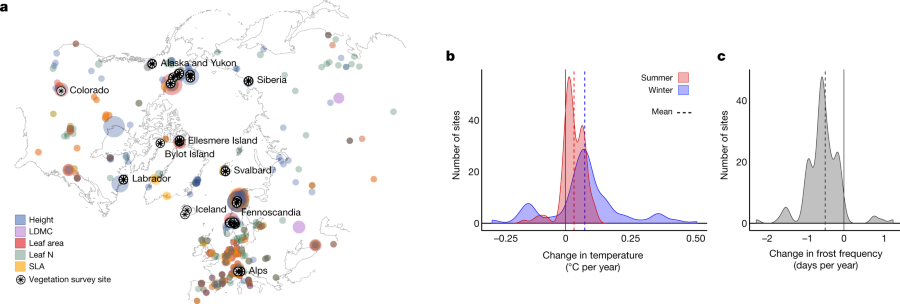
The caption:
a, Map of all 56,048 tundra trait records and 117 vegetation survey sites. b, c, Climatic change across the period of monitoring at the 117 vegetation survey sites, represented as mean winter (coldest quarter) and summer (warmest quarter) temperature (b) and frost day frequency (c). The size of the coloured points on the map indicates the relative quantity of trait measurements (larger circles indicate more measurements of that trait at a given location) and the colour indicates which trait was measured. The black stars indicate the vegetation survey sites used in the community trait analyses (most stars represent multiple sites). Trait data were included for all species that occurred in at least one tundra vegetation survey site; thus, although not all species are unique to the tundra, all do occur in the tundra. Temperature change and frost frequency change were estimated for the interval over which sampling was conducted at each site plus the preceding four years, to best reflect the time window over which tundra plant communities respond to temperature change20,29.
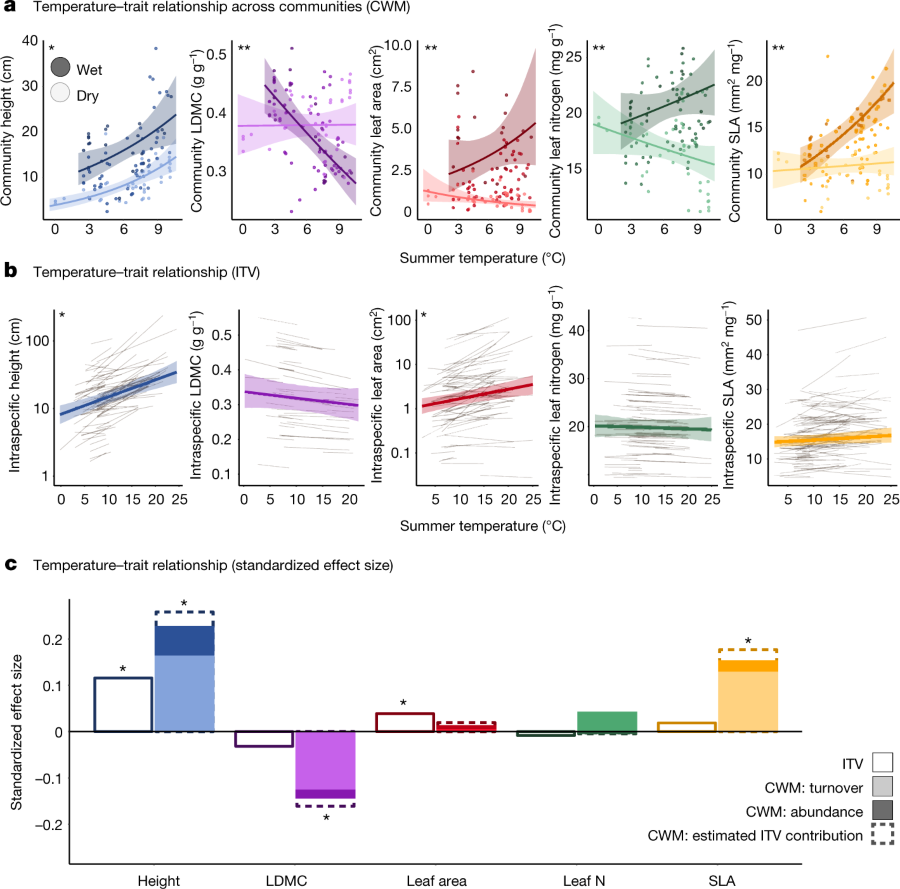
The caption, where "IVT" is intraspecific variation; "CWM" is community-weighted trait means ;"LDMC" leaf dry matter content:
a, Spatial relationship between community-level (CWM) functional traits, mean summer (warmest quarter) temperature and soil moisture (n?=?1,520 plots within 117 sites within 72 regions). b, Spatial relationship between summer temperature and ITV (note the log scale for height and leaf area). c, Standardized effect sizes were estimated for all temperature–trait relationships both across communities (CWM; solid bars) and within species (ITV; open bars with solid outlines). Effect sizes for CWM temperature–trait relationships were further partitioned into the proportion of the effect driven solely by species turnover (light bars) and abundance shifts (dark bars) over space. Dashed lines indicate the estimated additional contribution of ITV to the total temperature–trait relationship (CWM + ITV). The contribution of ITV is estimated from the spatial temperature–trait relationships modelled in b. Soil moisture in a was modelled as continuous but is shown predicted only at low and high values to improve visualization. Transparent ribbons in a and b indicate 95% credible intervals for model mean predictions. Grey lines in b represent intraspecific temperature–trait relationships for each species (height, n?=?80 species; LDMC, n?=?43; leaf area, n?=?85; leaf nitrogen content (leaf N), n?=?85; SLA, n?=?108; the number of observations per trait is shown in Supplementary Table 1). In all panels, asterisks indicate that the 95% credible interval on the slope of the temperature–trait relationship did not overlap zero. In a, two asterisks indicate that the temperature × soil moisture interaction term did not overlap zero. Winter temperature–trait relationships are shown in Extended Data Fig. 2. Community woodiness and evergreenness are shown in Extended Data Fig. 3.
More graphical data:
The caption:
a, Spatial relationship between community-level (CWM) functional traits, mean summer (warmest quarter) temperature and soil moisture (n?=?1,520 plots within 117 sites within 72 regions). b, Spatial relationship between summer temperature and ITV (note the log scale for height and leaf area). c, Standardized effect sizes were estimated for all temperature–trait relationships both across communities (CWM; solid bars) and within species (ITV; open bars with solid outlines). Effect sizes for CWM temperature–trait relationships were further partitioned into the proportion of the effect driven solely by species turnover (light bars) and abundance shifts (dark bars) over space. Dashed lines indicate the estimated additional contribution of ITV to the total temperature–trait relationship (CWM + ITV). The contribution of ITV is estimated from the spatial temperature–trait relationships modelled in b. Soil moisture in a was modelled as continuous but is shown predicted only at low and high values to improve visualization. Transparent ribbons in a and b indicate 95% credible intervals for model mean predictions. Grey lines in b represent intraspecific temperature–trait relationships for each species (height, n?=?80 species; LDMC, n?=?43; leaf area, n?=?85; leaf nitrogen content (leaf N), n?=?85; SLA, n?=?108; the number of observations per trait is shown in Supplementary Table 1). In all panels, asterisks indicate that the 95% credible interval on the slope of the temperature–trait relationship did not overlap zero. In a, two asterisks indicate that the temperature × soil moisture interaction term did not overlap zero. Winter temperature–trait relationships are shown in Extended Data Fig. 2. Community woodiness and evergreenness are shown in Extended Data Fig. 3.
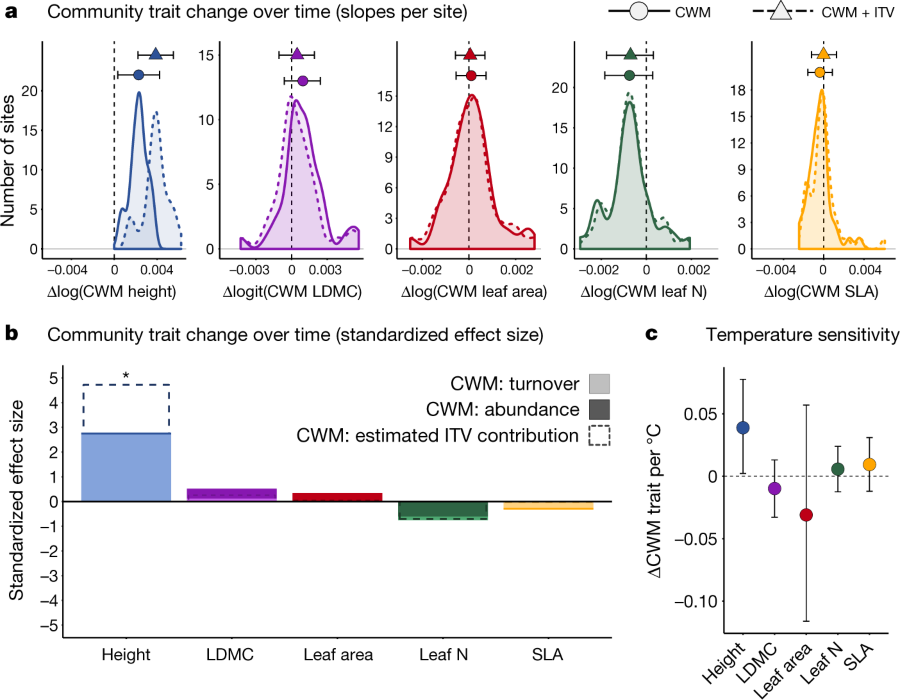
The caption:
a, Observed community trait change per year (transformed units). Solid lines indicate the distribution of CWM model slopes (trait change per site) whereas dashed lines indicate change in CWM plus potential intraspecific change modelled from spatial temperature–trait relationships (CWM + ITV). Circles (CWM) or triangles (CWM + ITV) and error bars indicate the mean and 95% credible interval for the overall rate of trait change across all sites (n?=?4,575 plot-years within 117 sites within 38 regions). The vertical black dashed line indicates 0 (no change over time). b, Standardized effect sizes for CWM change over time were further partitioned into the proportion of the effect driven solely by species turnover (light bars) or shifts in abundance of resident species (dark bars) over time. Dashed lines indicate the estimated additional contribution of ITV to total trait change over time (CWM + ITV). Asterisks indicate that the 95% credible interval on the mean hyperparameter for CWM trait change over time did not overlap zero. c, Temperature sensitivity of each trait (that is, correspondence between interannual variation in CWM trait values and interannual variation in summer temperature). Temperatures associated with each survey year were estimated as five-year means (temperature of the survey year and four preceding years), because this interval has been shown to be most relevant to vegetation change in tundra20 and alpine29 plant communities. Circles represent the mean temperature sensitivity across all 117 sites, error bars are 95% credible intervals on the mean. Changes in community woodiness and evergreenness are shown in Extended Data Fig. 3.
Some remarks on plant height:
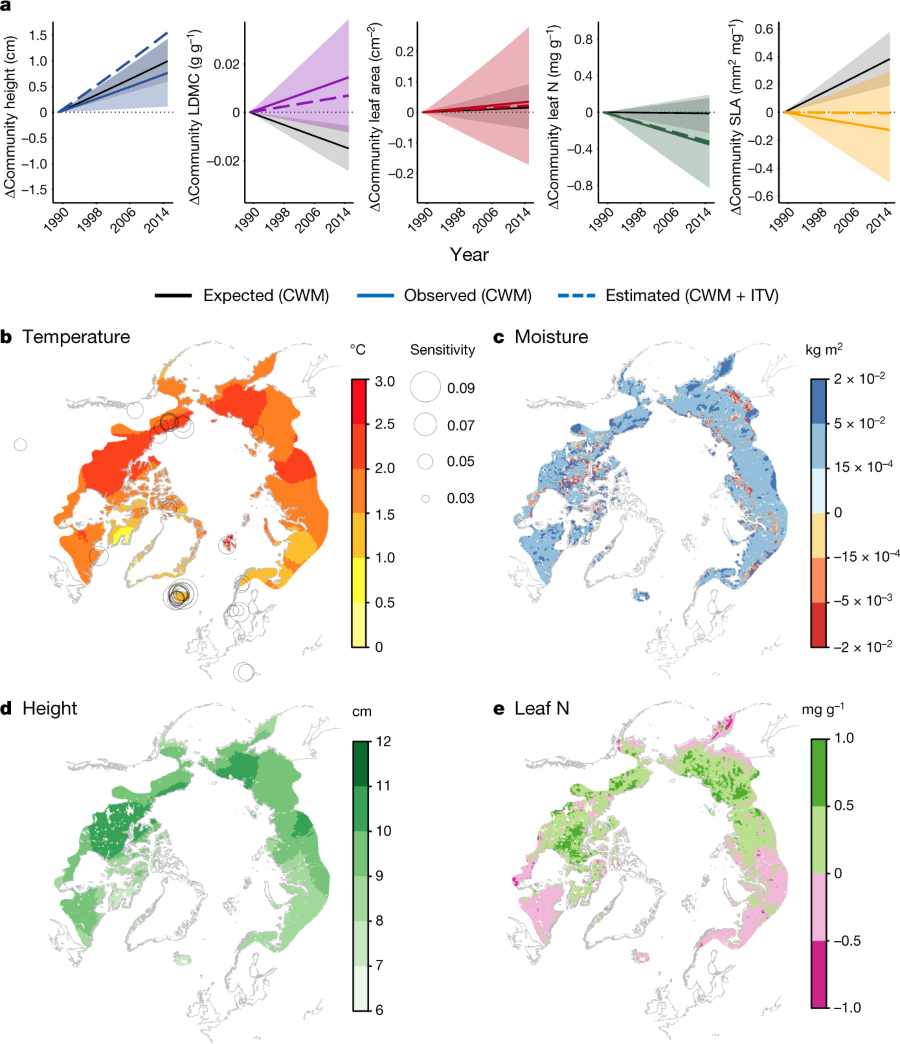
The caption:
a, Observed community (CWM) trait change over time (coloured lines) across all 117 sites versus expected CWM change over the duration of vegetation monitoring (1989–2015) based on the spatial temperature–trait (CWM) relationship and the average rate of recent summer warming across all sites (solid black lines). Coloured dashed lines indicate the estimated total change over time if predicted intraspecific trait variability is also included (CWM + ITV). Values on the y axis represent the magnitude of change relative to 0 (that is, trait anomaly), with 0 representing the trait value at t0. b, c, Total recent temperature change (b) and soil moisture change (c) across the Arctic tundra (1979–2016). Temperature change estimates are derived from gridded temperature data from the Climate Research Unit (CRU), estimates of changes in soil moisture are derived from downscaled European Centre for Medium-Range Weather Forecasts Re-Analysis (ERA-Interim) soil moisture data. Circles in b represent the sensitivity (cm per °C) of CWM plant height to summer temperature at each site (see Fig. 3c). Areas of high temperature sensitivity are expected to experience the greatest increases in height with warming. d, e, Spatial trait–temperature–moisture relationships (Fig. 2a) were used to predict total changes in height (d) and leaf nitrogen content (e) over the entire 1979–2016 period based on concurrent changes in temperature and soil moisture. Note that d and e reflect the magnitude of expected change between 1979 and 2016, not observed trait change. See Methods for details on estimates of the change in temperature and soil moisture. The outline of Arctic areas is based on the Circumpolar Arctic Vegetation Map (http://www.geobotany.uaf.edu/cavm).
The authors describe possible positive and negative feedbacks associated with our inability to address the rising tragedy of fossil fuels:
Recent (observed) and future (predicted) changes in plant traits, particularly height, are likely to have important implications for ecosystem functions and feedback effects involving soil temperature30,31, decomposition5,10 and carbon cycling32, as the potential for soil carbon loss is particularly great in high-latitude regions4. For example, increasing plant height could offset warming-driven carbon loss through increased carbon storage due to woody litter production5 or through reduced decomposition owing to lower summer soil temperatures caused by shading3,30,32 (negative feedback effects). Positive feedback effects are also possible if branches or leaves above the snowpack reduce albedo11,12 or increase snow accumulation, leading to warmer soil temperatures in winter and increased decomposition rates3,11. The balance of these feedback systems—and thus the net effect of trait change on carbon cycling—may depend on the interaction between warming and changes in snow distribution33 and water availability34, which remain mostly unknown for the tundra biome.
We need to understand this stuff, but we are in no place to change what it happening, particularly with the international will to celebrate ignorance, racism, rape and ethical vapidity, which prevents us from doing what might have been done. With no reference to my screen name, we are at the nadir, or at least one hopes so.
Nature - and here I'm not referring to the journal but to reality - is affected by politics, of course, but it will do what it will do independent of politics. Politicians can destroy the world by denial, inaction, or lies - and our contempt for the future suggests this is a real possibility - but they can not pass laws to demand that rain or snow fall, or that winds blow or don't blow, or food grows or doesn't grow.
It is easy to criticize our current Congress and it's now publicly and openly stated fondness for rape and for lies - as well as the administration's hatred of children and in fact, all future generations - but frankly, as an advocate of nuclear energy which I regard as the only technology that might work to address climate change - nuclear energy is often demonized by what I regard as "ersatz environmentalists" who complain it's not perfect (and it isn't) as if anything was - in my opinion we on the left are not innocent in the creation of the situation in the Tundra and elsewhere around the world, in every space the atmosphere touches.
"We" seem to think the solution is involved with Elon Musk's stupid electric car for billionaires and millionaires and other consumer junk like that, "all new stuff."
It isn't.
I hope you will have a pleasant and rewarding weekend.
InfoView thread info, including edit history
TrashPut this thread in your Trash Can (My DU » Trash Can)
BookmarkAdd this thread to your Bookmarks (My DU » Bookmarks)
0 replies, 660 views
ShareGet links to this post and/or share on social media
AlertAlert this post for a rule violation
PowersThere are no powers you can use on this post
EditCannot edit other people's posts
ReplyReply to this post
EditCannot edit other people's posts
Rec (5)
ReplyReply to this post