July payroll employment rises (+163,000); jobless rate essentially unchanged (8.3%)
Source: Bureau of Labor Statistics
THE EMPLOYMENT SITUATION -- JULY 2012
Total nonfarm payroll employment rose by 163,000 in July, and the unemployment rate
was essentially unchanged at 8.3 percent, the U.S. Bureau of Labor Statistics reported
today. Employment rose in professional and business services, food services and drinking
places, and manufacturing.
Household Survey Data
Both the number of unemployed persons (12.8 million) and the unemployment rate (8.3
percent) were essentially unchanged in July. Both measures have shown little movement
thus far in 2012. (See table A-1.)
Among the major worker groups, the unemployment rate for Hispanics (10.3 percent) edged
down in July, while the rates for adult men (7.7 percent), adult women (7.5 percent),
teenagers (23.8 percent), whites (7.4 percent), and blacks (14.1 percent) showed little
or no change. The jobless rate for Asians was 6.2 percent in July (not seasonally
adjusted), little changed from a year earlier. (See tables A-1, A-2, and A-3.)
In July, the number of long-term unemployed (those jobless for 27 weeks and over) was
little changed at 5.2 million. These individuals accounted for 40.7 percent of the
unemployed. (See table A-12.)
Read more: http://www.bls.gov/news.release/empsit.nr0.htm
Good morning, Freepers and DUers alike. I especially welcome viewers from across the aisle. You're paying for this information too, so you ought to see this as much as anyone.
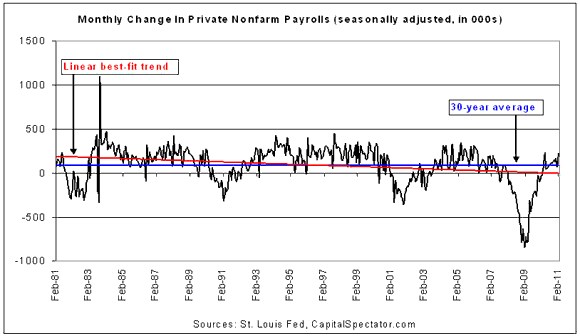
I heard an estimate earlier this morning that the growth in employment would be on the order of 100,000. What is important about these statistics is not so much this month’s number, but the trend. So let’s look at some earlier numbers. We’ll start with the ADP estimate.
ADP, for employment in July:
The ADP National Employment Report July 2012
BLS, for employment in June:
http://www.democraticunderground.com/1014160067
Payroll employment continues to edge up in June (+80,000); jobless rate unchanged (8.2%)
Of particular importance for the BLS estimate for June was this article from that day’s Wall Street Journal.
Unemployment Line Longer Than It Looks‎
AHEAD OF THE TAPE
Updated July 5, 2012, 7:26 p.m. ET
By SPENCER JAKAB Here is a statistic for the politically inclined: No incumbent president has won re-election with an unemployment rate above 7.2% since the Great Depression.
Economists expect Friday's release of June employment data will show 95,000 new jobs added. Meantime, the unemployment rate is seen unchanged at 8.2%. That may be bittersweet or just plain bitter depending on one's political slant, but it is difficult to reconcile today's rate with past periods.
The headline unemployment rate has been flattered by the number of people no longer counted in the denominator used to calculate it. For example, a comparison of jobs data between the start and end of 2011 shows the ranks of the unemployed fell by 822,000 while the number of people not in the labor force grew by a larger 1.24 million. The unemployment rate fell by 0.6 percentage points over that time to 8.5%.
In fact, the participation rate—the share of the working-age population either working or looking for work—has fallen by 2.3 percentage points over the four years through May to 63.8%, a three-decade low. Nearly 88 million people—about seven times the ranks of the officially unemployed—aren't part of the headline rate's calculation.
Hmmm. Give that some thought. Also, when May'’s figures were released, Judson Phillips of Tea Party Nation was on Tom Hartmann that Friday night. He kept referring to the "U-6 Number." That can be found in Table A15. It is "Total unemployed, plus all persons marginally attached to the labor force, plus total employed part time for economic reasons, as a percent of the civilian labor force plus all persons marginally attached to the labor force." It appears in two forms, seasonally adjusted and non-seasonally adjusted. Either way, it is the least optimistic of all the estimates.
ADP, for employment in June:
ADP jobs up 176,000 (for June)
BLS, for employment in May:
http://www.democraticunderground.com/1014133487
May payroll employment changes little (+69,000); jobless rate essentially unchanged (8.2%)
ADP, for employment in May:
http://www.democraticunderground.com/1014132307
May change in employment +133,000
BLS, for employment in April:
http://www.democraticunderground.com/1014113023
Payroll employment rises 115,000 in April; unemployment rate changes little (8.1%)
ADP and Gallup, for employment in April:
There were four related threads about the April jobs estimate at DU already. Three are in General Discussion, and they are based on the figures from ADP. The fourth, in LBN, paints a contrasting picture. It relies on the figures from Gallup.
http://www.democraticunderground.com/1002635553
Per CNBC - ADP Numbers bad, posted by Laura PourMeADrink
http://www.democraticunderground.com/1002635507
BAD: ADP JOBS REPORT MISSES EXPECTATIONS BY A MILE, posted by xchrom
http://www.democraticunderground.com/1002635837
ADP & TrimTabs Showing Much Weaker Payrolls Ahead of Unemployment Report, posted by marmar
http://www.democraticunderground.com/1014111465
U.S. Job Creation Nears Four-Year High, posted by brooklynite
There's a joke about economists in there somewhere.
March, BLS:
Payroll employment rises 120,000 in March; unemployment rate changes little (8.2%)
March, ADP:
Businesses Adding 209,000 New Jobs Last Month Fail To Ignite Market Rally
February, ADP:
ADP Estimates U.S. Companies Added 216,000 Jobs in February, posted by Gruntled Old Man.
One more thing:
So how many jobs must be created every month to have an effect on the unemployment rate? There's an app for that.
http://www.frbatlanta.org/chcs/calculator/index.cfm
Federal Reserve Bank of Atlanta Jobs Calculator™
Well, enough of that. On with the show.
Monthly Employment Reports
The large print giveth, and the fine print taketh away.
A DU'er pointed out several months ago that, if I'm going to post the link to the press release, I should include the link to all the tables that provide additional ways of examining the data. Specifically, I should post a link to "Table A-15. Alternative measures of labor underutilization." Table A-15 includes those who are not considered unemployed, on the grounds that they have become discouraged about the prospects of finding a job and have given up looking. Here are those links.
Employment Situation
Table A-15. Alternative measures of labor underutilization
From the February 10, 2011, "DOL Newsletter":
Take Three
Secretary Solis answers three questions about how the Bureau of Labor Statistics calculates unemployment rates.
How does BLS determine the unemployment rate and the number of jobs that were added each month?
BLS uses two different surveys to get these numbers. The "household survey," or Current Population Survey (CPS), involves asking people, from about 60,000 households, a series of questions to assess each person in the household's activities including work and searching for work. Their responses give us the unemployment rate. The "establishment survey," or Current Employment Statistics (CES), surveys 140,000 employers about how many people they have on their payrolls. These results determine the number of jobs being added or lost.
 = new reply since forum marked as read
Highlight:
NoneDon't highlight anything
5 newestHighlight 5 most recent replies
= new reply since forum marked as read
Highlight:
NoneDon't highlight anything
5 newestHighlight 5 most recent replies
flpoljunkie
(26,184 posts)flpoljunkie
(26,184 posts)
CBHagman
(16,984 posts)I was expecting this to be spun as complete gloom and doom, as happened last month, but apparently it's considered an encouraging sign.

ladjf
(17,320 posts)jtuck004
(15,882 posts)
Robbins
(5,066 posts)More jobs were created In July than what was expected.That Is good.However the only thing the MSM will report On Is Unemployment
at 8.3.Does It matter under Bush we were losing jobs not creating them and Obama has done as much he could without any help
by congress(despite what teabagers would have you believe Obama Is no dicator who can just do whatever he want) Not according
to them and all Republicans they will have on today cheering the 8.3 unemployment.
flpoljunkie
(26,184 posts)
I think we're still at negative job growth under Obama, but it's close to breaking even for 2/09 to the present. My #s might be a couple of months stale.
Job growth hasn't been horrible--not good, but not horrible--under Obama, if you discount the first few months. You have to watch what is happening at the beginning and cut-off dates to make sense of the #s. Otherwise they're just numbers and not so meaningful.
If you abstract away recessions, you get #s that aren't too different. In 2001 nobody could "inherit a recession"--you had to man up for any economic conditions the week you were inaugurated; 12 years later, you're no responsible for things 3 years after inauguration. So first thing, remove the politics. Politics is rhetoric, and rhetoric is a different field from logic. Logic helps understanding; rhetoric is to convince people, whatever it takes.
The cry in the '00s was always that #s like 100k or 150k jobs/moth created was less than needed, the recovery was weak, etc. Those #s aren't much different from now. The spin is different. Spin is rhetoric. We seem to be having a recession every 9-10 years. The trendline for job creation during recovery is heading downward. What logical use you make of those is still up for grabs.
(on edit: The nifty chart that came up to near the present had a bad link character. Under Obama, there was an early spike and then the line looks very much like 2004.)

BeyondGeography
(39,370 posts)liberallibral
(272 posts)Romney and the GOP will still harp on the 8.3% unemployment... Let's just hope that comes down a little, and the jobs keep on comin'! 
RBInMaine
(13,570 posts)BeyondGeography
(39,370 posts)RBInMaine
(13,570 posts)The UE rate went up because Total Employment (NOT the jobs numbers) went down 193,000 and unemployment went up 45,000.
Looking at the labor force flows: http://www.bls.gov/cps/cps_flows_current.pdf it is true that the increase in Unemployed was due to people entering the labor force, but more people left the labor force (from employed) making the labor force go down.

jinx1
(45 posts)Congress has failed miserably on the employment front. If the jobs that had been outsourced were still in America that number would be in the 6% range but the Republicans couldn't support tax benefits for bringing home JOBS to America. The JOBS JOBS ABORTION congress that voted over 30 times to block healthcare is now on break for 5 weeks...because they have jobs and don't care if another person gets hired till after the election. The added bonus is the nation continues to suffer and they can try to blame OBAMA...but we are all in on the scam. If my vote counts for anything...they will lose their jobs and millions will be going back to work in November.
MannyGoldstein
(34,589 posts)In his speech last year, Obama mentioned four jobs bills - three of these were the "free" trade acts that Congress went on to pass.

earthside
(6,960 posts)From the BLS
Table A
Household Data
http://www.bls.gov/news.release/pdf/empsit.pdf
Employed
June 2012: 142,415
July 2012: 142,220
Change: -195
Unemployed
June 2012: 12,749
July 2012: 12,794
Change: +45
Unemployment rate
June 2012: 8.2
July 2012: 8.3
Change: +.1
That doesn't look 'encouraging' to me.
4th law of robotics
(6,801 posts)there is no way to explain it away as a good thing unless you want to go the "it could have been far worse" route.
Things are looking pretty bleak for the economy.

bhikkhu
(10,715 posts)...so a couple of months back there were 780K or so new employed, but seasonal adjustments erased most of those gains. If you're going to stress over the adjustments that make the numbers look better, then look at the adjustments that make the numbers look worse as well.
The point of seasonal adjustments is that many jobs are seasonal in nature; if not for adjustments, we'd be having a huge party looking at the jobs numbers half the time, and then a fear-fest looking at the numbers the rest of the time. Its not perfect, but the formulas are consistent and consistently applied.
stockholmer
(3,751 posts)The report for July is annually adjusted by a larger amount than for any other month save January. This July 2012 adjustment (via both Seasonal and Birth/Death adjustments) was the largest in at least the last decade, and possibly in history. (see graph below)
http://www.businessinsider.com/seasonal-fun-with-job-numbers-2012-8
Binyamin Appelbaum has an interesting piece http://economix.blogs.nytimes.com/2012/08/02/beware-the-jobs-report-of-july/ reminding readers of the importance of the seasonal adjustments in the job numbers that are released each month. It points out that July has the second largest positive seasonal adjustment, after January, of any month. (I don't quite understand the chart, which seems to show positive seasonal adjustments for every month.) For example, last year the seasonal adjustment added 1.3 million jobs to the raw data, turning the seasonally adjusted number into a gain of 96,000 jobs, despite an unadjusted loss of 1.3 million jobs. Appelbaum's point is that a small error in the size of the adjustment would have a huge impact on the jobs number reported for July.
The point is actually even more important than Appelbaum suggests. There are very large changes in employment month to for seasonal factors that have nothing directly to do with the state of the economy. When these patterns change then the jobs numbers will give us a misleading picture of the state of the economy.
That is why the unusually warm winter weather gave an overly optimistic picture of the economy. Since this job growth was borrowed from the spring, the subsequent months gave us an overly pessimistic picture of the economy. Seasonal patterns can also change for reasons not directly related to weather. For example, stores now start holiday sales as early as October and the auto industry no longer shuts down all their factories in July for retooling.
Anyhow, Appelbaum is right to remind us about the importance of seasonal factors in the jobs numbers. We might not need a weatherman to know which way the wind blows, but we do need one to know how the economy is doing.
snip
------------------------------------------------------
http://economix.blogs.nytimes.com/2012/08/02/beware-the-jobs-report-of-july/
----------------------------------------------------------------
July jobs report: Why the unemployment rate just won’t budge
http://www.washingtonpost.com/blogs/ezra-klein/wp/2012/08/03/jobs-report-u-s-economy-still-sputtering-along/
The U.S. economy added 163,000 jobs in July, according to data from the Bureau of Labor Statistics. And the unemployment rate stayed essentially unchanged, even nudging up slightly from 8.2 percent to 8.3 percent (actually, if you want to get technical, it went from 8.22 percent to 8.25 percent).
The bright spot here is that the job market isn’t getting dramatically worse. Those 163,000 new jobs were more than forecasters expected. July’s jobs figures were also much better than the disappointing reports in May and June. The more troubling news, however, is that the economy isn’t getting dramatically better, either.
This has been the case for quite some time: In the first seven months of 2012, the economy has added 151,000 jobs per month on average. That’s on par with 2011, when the economy added an average of 153,000 jobs per month. That’s enough to keep up with the growth of the U.S. population. But it’s not enough to bring down the unemployment rate dramatically. According to the Hamilton Project’s jobs calculator, if we keep adding 151,000 jobs per month, on average, we won’t return to pre-recession levels of employment until after 2025.
Some other points of interest in the report: BLS revised its numbers slightly for previous months. The figures from May got revised up from 77,000 new jobs to 87,000. And June’s numbers got revised down, from 80,000 to 64,000.
snip
---------------------------------------------------------------------------------------
Seasonal And Birth Death Adjustments Add 429,000 Statistical "Jobs"
http://www.zerohedge.com/news/seasonal-and-birth-death-adjustments-add-429000-statistical-jobs
Happy by the headline establishment survey print of 133,245 which says that the US "added" 163,000 jobs in July from 133,082 last month? Consider this: the number was based on a non seasonally adjusted July number of 132,868. This was a 1.248 million drop from the June print. So how did the smoothing work out to make a real plunge into an "adjusted" rise? Simple: the BLS "added" 377K jobs for seasonal purposes. This was the largest seasonal addition in the past decade for a July NFP print in the past decade, possibly ever, as the first chart below shows. But wait, there's more: the Birth Death adjustment, which adds to the NSA Print to get to the final number, was +52k. http://www.bls.gov/web/empsit/cesbd.htm
How does this compare to July 2011? It is about 1000% higher: the last B/D adjustment was a tiny +5K! In other words, of the 163,000 jobs "added", 429,000 was based on purely statistical fudging. Doesn't matter - the flashing red headline is good enough for the algos.
Seasonal Adjustment:


snip
vkkv
(3,384 posts)Not so good, huh?

alp227
(32,019 posts)And I'd like to bring up that 1980 had four straight months of job LOSSES (following figures in the 1000s):

April 1980: -145
May 1980: -431
June 1980: -320
July 1980: -263
Total: 1.16 million jobs lost
Compare that with those months of 2012:

April 2012: 68
May 2012: 87
June 2012: 64(P)
July 2012: 163(P)
Total: 382,000 jobs created
Using the BLS job growth table tool, I found that the period from Jan. to Oct. 1980 had a net job loss of 184,000. In contrast, the first 7 months of 2012 have generated 1.06 million jobs.
Expect an extremely desperate, distasteful RATpubliCON dirty trick soon.
It seems that anytime even one month has net job losses, that means the incumbent loses. The first ten months of 1992 had a net gain of 803,000 jobs. Yet George H.W. Bush lost. Why? Not just on breaking his "read my lips: no new taxes" pledge but also the sluggish economy that began the '90s as well as February 1992 having a net loss of 66,000 jobs. Yes, the only month of job losses of that year but still costly nonetheless.
And if this gives you any more hope, Dim Son Bush won in 2004 under a net gain of 1.86 million jobs from Jan. to Oct. 2004.
Furthermore:
- 2000 had two months with job losses (June, -47k; October, -12k...hmm OCTOBER SURPRISE???), and the incumbent party lost (yes I know about Florida but let's set that aside due to this general trend I'm noticing about election year job losses.)
- January 1968 had a job loss of 95k but 9 straight months of growth afterwards. Still, a loss for the incumbent party, but more due to the politics surrounding the Vietnam War and post-MLK death urban crime.
In the elections of 1984 and 2004, both in which the incumbent president was re-elected, those years had zero net job losses in any month.
These presidents survived re-election despite any monthly job loss:
- FDR won his fourth election in 1944 despite job losses for the first nine months of the year. Obviously 1944 was during WWII, and wars generally guarantee the incumbent president re-election (and this was before the 22nd amendment limited presidents to two terms in office). Same in 1940 (right before the War).
- Truman in 1948. Three months of that year (including OCTOBER) had job losses. 1948 pre-election gained a meager 672k jobs, but Truman succeeded largely thru a "Do-Nothing Congress" election strategy.
- Eisenhower won re-election in 1956, but two of the first ten months that year had losses. (Total net gain of jobs Jan-Oct 1956: 976k.)
- LBJ, who as vice president became president after the assassination of JFK, won the 1964 election despite a loss of 164k jobs the month before the election. (Total net gain for first 10 months: 1.43m.)
- Nixon won re-election in 1972 despite July 1972 losing 51k jobs. (1972 gained 2.56m jobs before November.)
- Clinton won re-election in 1996 even though the year began with a loss of 21k. (1996 gained 2.33m jobs pre-election.)
In the other elections in which the president was re-elected (Reagan 1984, Dim Son 2004), all the first ten months had net job gains.
Response to mahatmakanejeeves (Original post)
Name removed Message auto-removed