Welcome to DU!
The truly grassroots left-of-center political community where regular people, not algorithms, drive the discussions and set the standards.
Join the community:
Create a free account
Support DU (and get rid of ads!):
Become a Star Member
Latest Breaking News
General Discussion
The DU Lounge
All Forums
Issue Forums
Culture Forums
Alliance Forums
Region Forums
Support Forums
Help & Search
General Discussion
Related: Editorials & Other Articles, Issue Forums, Alliance Forums, Region Forums
InfoView thread info, including edit history
TrashPut this thread in your Trash Can (My DU » Trash Can)
BookmarkAdd this thread to your Bookmarks (My DU » Bookmarks)
9 replies, 707 views
ShareGet links to this post and/or share on social media
AlertAlert this post for a rule violation
PowersThere are no powers you can use on this post
EditCannot edit other people's posts
ReplyReply to this post
EditCannot edit other people's posts
Rec (15)
ReplyReply to this post
9 replies
 = new reply since forum marked as read
Highlight:
NoneDon't highlight anything
5 newestHighlight 5 most recent replies
= new reply since forum marked as read
Highlight:
NoneDon't highlight anything
5 newestHighlight 5 most recent replies
= new reply since forum marked as read
Highlight:
NoneDon't highlight anything
5 newestHighlight 5 most recent replies
WHO raises global pandemic risk level (Original Post)
RandySF
Feb 2020
OP

jimfields33
(15,703 posts)1. Very high pandemic?
Wouldn’t it be a good idea to put pandemic in their teeet?

redqueen
(115,103 posts)8. No, because they aren't saying that.
gibraltar72
(7,499 posts)2. WHO did?

Dennis Donovan
(18,770 posts)4. I don't know
Third base. 


durablend
(7,456 posts)3. Guess they're part of the "deep state" now too
Watch out for Donnie Dipshit to start tweeting his supporters to burn all The Who's records

cyberswede
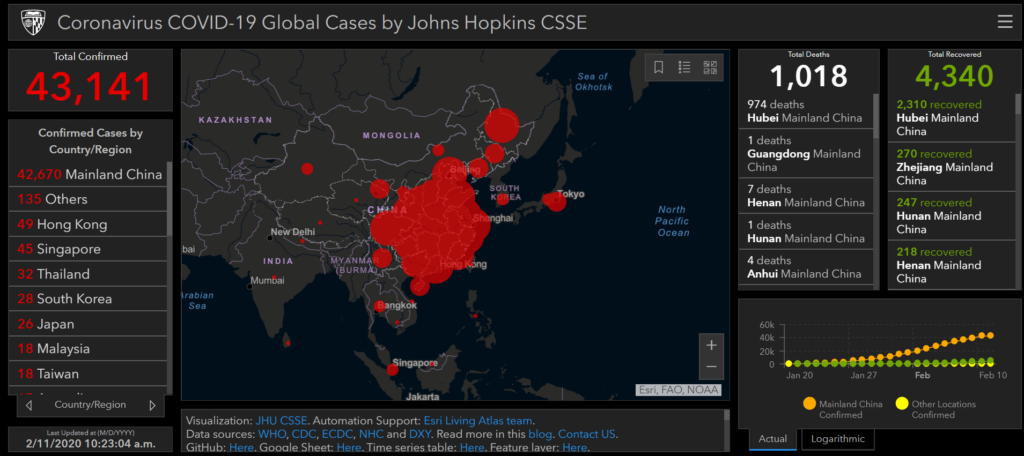
(26,117 posts)5. You can track cases on this map (Johns Hopkins)
https://systems.jhu.edu/research/public-health/ncov/
Mapping 2019-nCoV
By Lauren Gardner, January 23, 2020
In response to this ongoing public health emergency, we developed an interactive web-based dashboard hosted by the Center for Systems Science and Engineering (CSSE) at Johns Hopkins University, to visualize and track reported cases in real-time. The dashboard, first shared publicly on January 22, illustrates the location and number of confirmed COVID-19 cases, deaths and recoveries for all affected countries.
Live map:
https://gisanddata.maps.arcgis.com/apps/opsdashboard/index.html#/bda7594740fd40299423467b48e9ecf6
Screenshot from end of Jan (updated numbers at live map link above)

uponit7771
(90,304 posts)6. Everyone in Guandong China was quarantine for nearly a month, first source
redqueen
(115,103 posts)7. Why is the word "pandemic" in your subject line?

sarcasmo
(23,968 posts)9. Trump and his science deniers disagree. If you have Twitter follow @WHO
The World Health Organization has posted a bunch of true information this morning.