Just Another Day on Aerosol Earth
From https://earthobservatory.nasa.gov/images/92654/just-another-day-on-aerosol-earth
Just Another Day on Aerosol Earth
Take a deep breath. Even if the air looks clear, it is nearly certain that you will inhale millions of solid particles and liquid droplets. These ubiquitous specks of matter are known as aerosols, and they can be found in the air over oceans, deserts, mountains, forests, ice, and every ecosystem in between.
If you have ever watched smoke billowing from a wildfire, ash erupting from a volcano, or dust blowing in the wind, you have seen aerosols. Satellites like Terra, Aqua, Aura, and Suomi NPP “see” them as well, though they offer a completely different perspective from hundreds of kilometers above Earth’s surface. A version of a NASA model called the Goddard Earth Observing System Forward Processing (GEOS FP) offers a similarly expansive view of the mishmash of particles that dance and swirl through the atmosphere.
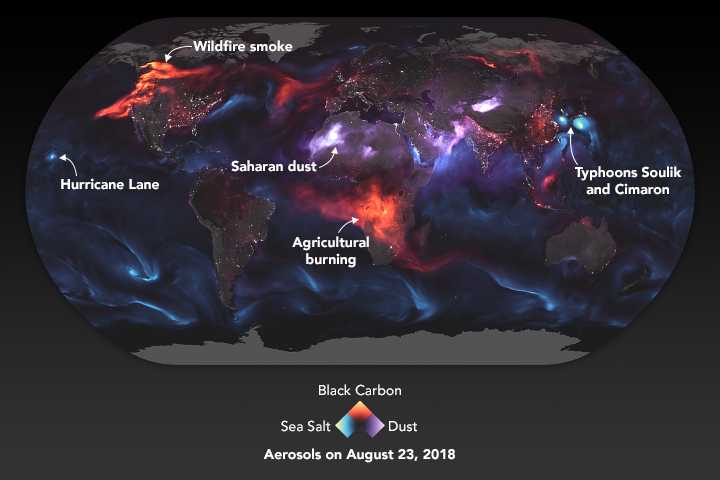
The visualization above highlights GEOS FP model output for aerosols on August 23, 2018. On that day, huge plumes of smoke drifted over North America and Africa, three different tropical cyclones churned in the Pacific Ocean, and large clouds of dust blew over deserts in Africa and Asia. The storms are visible within giant swirls of sea salt aerosol (blue), which winds loft into the air as part of sea spray. Black carbon particles (red) are among the particles emitted by fires; vehicle and factory emissions are another common source. Particles the model classified as dust are shown in purple. The visualization includes a layer of night light data collected by the day-night band of the Visible Infrared Imaging Radiometer Suite (VIIRS) on Suomi NPP that shows the locations of towns and cities.
Note: the aerosol in the visualization is not a direct representation of satellite data. The GEOS FP model, like all weather and climate models, used mathematical equations that represent physical processes to calculate what was happening in the atmosphere on August 23. Measurements of physical properties, like temperature, moisture, aerosols, and winds, are routinely folded into the model to better simulate real-world conditions.
...
More at link.