This from Paul Krugman's blog:
Heres part of what the people at Heritage are claiming the plan will accomplish:
not shown: page from Heritage Foundation projection showing their numbers for how Ryan's plan will supposedly affect the unemployment rate: 6.4 in 2012 dropping to 2.8 by 2021 -- JHBIn case youre having trouble reading that, heres the forecast for unemployment (the red line at the right) in the context of the historical record:
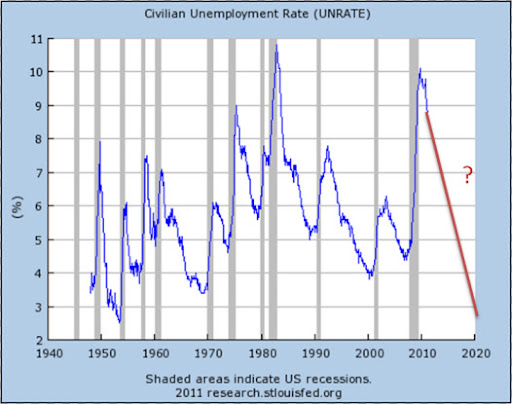
Except briefly during the Korean War, the United States has never achieved unemployment as low as Ryan and co. are claiming. The Fed believes that the lowest unemployment rate compatible with price stability is between 5 and 6 percent that is, twice what Ryan is claiming he will achieve.
Now, you may wonder how they get those numbers.
From the Analysis page at the Heritage Foundation:
CDA employed its tax models and the U.S. Macroeconomic Model of IHS Global Insight, Inc., to estimate the fiscal and economic effects of the House Budget Resolution.2 Center analysts primarily employed the CDA Individual Income Tax Model for its analysis of the effects of tax law changes on a representative sample of taxpayers based on IRS Statistics of Income (SOI) taxpayer microdata. Data for these taxpayers are extrapolated or "aged" to reflect detailed taxpayer characteristics. These data are aged for consistency with the Congressional Budget Office (CBO) baseline forecast in order to produce effective and marginal tax rate estimates with which to forecast the dynamic economic and fiscal effects stemming from changes in tax burden.3
Staff of the House Budget Committee supplied the CDA with sufficient detail on the House Budget Resolution to allow Center analysts to simulate the fiscal effects of changes in tax law and major programs and outlay categories. Details on the steps taken to incorporate these policy changes in the model are contained in Appendix 2 to this report.
What does policy simulation mean? Model simulation of public policy change requires two sets of data. First, estimates of how the changes affect outlays and revenues, which become the policy inputs to the dynamic model. Second, analysts need a baseline of economic and fiscal data that do not contain these policy changes. The model then calculates the difference it makes to the baseline when public policy changes. Thus, when we report, for example, that Gross Domestic Product increased by an annual average of $150 billion because of the policy changes contained in the Budget Resolution, this means that the dynamic model has estimated much more economic output over the amount contained in the baseline.
http://www.heritage.org/Research/Reports/2011/04/Economic-Analysis-of-the-House-Budget-ResolutionThey give the results of this simulation (same page):
The tax and program changes behind the Budget Resolution produce much stronger economic performance when compared to the rate and level of economic activity in the baseline.6 Lower taxes stimulate greater investment, which expands the size of business activity. This expansion fuels a demand for more labor, which enters a labor market that contains workers who themselves face lower taxes. Consequently, significantly higher employment ensues.
And there we have the fantasy-based economics: a simulation is written with certain assumptions of ideology or favored unproven (or falsified) theories built-in, the simulation produces rosy numbers, and those numbers are then used to justify implementing policy based on those assumptions, as "proof" of how it's the right thing to do.
But then, the report authors and the Heritage Foundation's donors won't exactly be handed a bill to make up the difference when their projections don't pan out.