Democratic Underground Latest Greatest Lobby Journals Search Options Help Login
Google

NSIDC - April Sea Ice Extent Near Average: Arctic Temperatures Above Average

Printer-friendly format Printer-friendly format
Printer-friendly format Email this thread to a friend
Printer-friendly format Bookmark this thread
This topic is archived.
Home » Discuss » Topic Forums » Environment/Energy Donate to DU
 
hatrack Donating Member (1000+ posts) Send PM | Profile | Ignore Sun May-09-10 10:21 AM
Original message
NSIDC - April Sea Ice Extent Near Average: Arctic Temperatures Above Average
During April, Arctic sea ice extent declined at a steady pace, remaining just below the 1979 to 2000 average. Ice extent for April 2010 was the largest for that month in the past decade. At the same time, changing wind patterns have caused older, thicker ice to move south along Greenland’s east coast, where it will likely melt during the summer. Temperatures in the Arctic remained above average.

Overview of conditions

Arctic sea ice extent averaged 14.69 million square kilometers (5.67 square miles) for the month of April, just 310,000 square kilometers (120,000 square miles) below the 1979 to 2000 average. The rate of ice extent decline for the month was also close to average, at 41,000 kilometers (16,000 square miles) per day. As a result, April 2010 fell well within one standard deviation of the mean for the month, and posted the highest April extent since 2001.

Ice extent remained slightly above average in the Bering Sea and Sea of Okhotsk, and slightly below average in the Barents Sea north of Scandinavia, and in Baffin Bay, where ice extent remained below average all winter.

Conditions in context

The very late maximum ice extent, on March 31, means that the melt season started almost a month later later than normal.

As we noted in last month's post, the late growth in ice extent came largely from expansion in the southernmost Bering Sea, Barents Sea, and Sea of Okhotsk. These areas remained cool, with northeasterly and northwesterly winds, keeping the overall ice extent close to the average for the month of April.

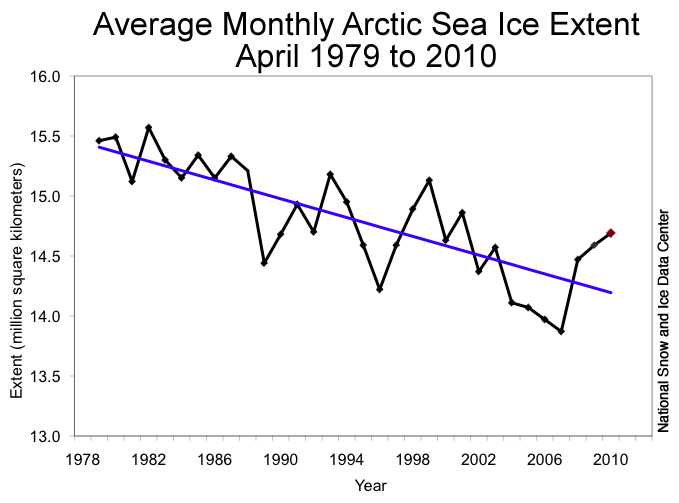
April 2010 compared to past years

Average ice extent for April 2010 was 820,000 square kilometers (317,000 square miles) greater than the record low for April, observed in 2007, and 310,000 square kilometers (120,000 square miles) below the average extent for the month. The linear rate of decline for April over the 1979 to 2010 period is now 2.6% per decade.

EDIT

http://nsidc.org/arcticseaicenews/index.html
Printer Friendly | Permalink |  | Top
The Croquist Donating Member (1000+ posts) Send PM | Profile | Ignore Sun May-09-10 10:20 PM
Response to Original message
1. Thanks for posting
I didn't have the guts to. This is, of course, good news but it falls closer to the category of "weather" then anything else. Some people will argue that the ice is thin and won't last but there seems to be at least a short term rebound in Arctic ice. additionally this is the third year of increases. Nobody knows if that trend will continue but it's certainly better then a downward trend.

Here are the numbers from their website:

http://nsidc.org/cgi-bin/bist/bist.pl?annot=1&legend=1&scale=100&tab_cols=1&tab_rows=32&config=seaice_index&submit=Refresh&mo0=04&hemis0=N&img0=extn&year0=2010&year1=2009&year2=2008&year3=2007&year4=2006&year5=2005&year6=2004&year7=2003&year8=2002&year9=2001&year10=2000&year11=1999&year12=1998&year13=1997&year14=1996&year15=1995&year16=1994&year17=1993&year18=1992&year19=1991&year20=1990&year21=1989&year22=1988&year23=1987&year24=1986&year25=1985&year26=1984&year27=1983&year28=1982&year29=1981&year30=1980&year31=1979

2007 13.9
2008 14.4
2009 14.6
2010 14.7

The 1979 - 2010 average is 14.8 so we're close. The Arctic Sea Ice News and Analysis that you quoted
talks about the 1979-2000 average which is 15.0 sq km.
Printer Friendly | Permalink |  | Top
 
Viking12 Donating Member (1000+ posts) Send PM | Profile | Ignore Mon May-10-10 06:58 AM
Response to Reply #1
2. Better than a downward trend?
Do you know what a trend is?

Printer Friendly | Permalink |  | Top
 
The Croquist Donating Member (1000+ posts) Send PM | Profile | Ignore Mon May-10-10 08:22 AM
Response to Reply #2
3. Yes I know what a trend is
That is why I used the term "weather" to describe the recent 3 year rebound. I also called it good news. 3 years of gains is nothing to be sneezed at. The only other time it happened was 1996 - 1999. Of course the only time we've ever had a 3 year decreasing trend was 1993-1996 and we've seen a decline from 15.5 million sq km to 14.7 or 5.16% since 1979. Personally I'd rather have more Sea Ice then less.

If it makes you feel better the Antarctic is having a lousy year. The April number is 7.3 million sq km down from the 1979 number of 8.2 million sq km a 10.98% drop. That is probably weather too since the all time high was set 2 years ago in 2008 at 8.6 million sq km and the 2010 number is close to the 1979-2010 average of 7.36875 million sq km.
Printer Friendly | Permalink |  | Top
 
jpak Donating Member (1000+ posts) Send PM | Profile | Ignore Mon May-10-10 09:06 AM
Response to Reply #2
4. You're wasting your time - deniers deny all data they don't like (that is ALL the data)
yup!
Printer Friendly | Permalink |  | Top
 
The Croquist Donating Member (1000+ posts) Send PM | Profile | Ignore Mon May-10-10 09:54 AM
Response to Reply #4
5. You mean the data that this denier was just talking about?
April Northern Hemisphere Sea Ice:

1979 15.5
1980 15.5
1981 15.1 1991 14.9 2001 14.9
1982 15.6 1992 14.7 2002 14.4
1983 15.3 1993 15.2 2003 14.6
1984 15.1 1994 15.0 2004 14.1
1985 15.3 1995 14.6 2005 14.1
1986 15.1 1996 14.2 2006 14.0
1987 15.3 1997 14.6 2007 13.9
1988 15.2 1998 14.9 2008 14.4
1989 14.4 1999 15.1 2009 14.6
1990 14.7 2000 14.6 2010 14.7


April Southern Hemisphere Sea Ice:
1979 8.2
1980 5.9
1981 6.3 1991 7.5 2001 7.5
1982 8.3 1992 7.4 2002 7.0
1983 7.1 1993 7.2 2003 7.7
1984 7.0 1994 7.7 2004 7.8
1985 7.1 1995 7.8 2005 7.5
1986 6.9 1996 8.0 2006 6.6
1987 7.4 1997 7.1 2007 6.8
1988 6.8 1998 7.6 2008 8.6
1989 6.8 1999 7.3 2009 8.3
1990 7.5 2000 7.8 2010 7.3


Printer Friendly | Permalink |  | Top
 
DU AdBot (1000+ posts) Click to send private message to this author Click to view 
this author's profile Click to add 
this author to your buddy list Click to add 
this author to your Ignore list Thu Apr 18th 2024, 09:30 PM
Response to Original message
Advertisements [?]
 Top

Home » Discuss » Topic Forums » Environment/Energy Donate to DU

Powered by DCForum+ Version 1.1 Copyright 1997-2002 DCScripts.com
Software has been extensively modified by the DU administrators


Important Notices: By participating on this discussion board, visitors agree to abide by the rules outlined on our Rules page. Messages posted on the Democratic Underground Discussion Forums are the opinions of the individuals who post them, and do not necessarily represent the opinions of Democratic Underground, LLC.

Home  |  Discussion Forums  |  Journals |  Store  |  Donate

About DU  |  Contact Us  |  Privacy Policy

Got a message for Democratic Underground? Click here to send us a message.

© 2001 - 2011 Democratic Underground, LLC