Democratic Underground Latest Greatest Lobby Journals Search Options Help Login
Google

JPL - Antarctic Losing 100 Km3 In Ice Mass Annually Since 2002; Bulk Of Loss In W. Antarctica - AFP

Printer-friendly format Printer-friendly format
Printer-friendly format Email this thread to a friend
Printer-friendly format Bookmark this thread
This topic is archived.
Home » Discuss » Topic Forums » Environment/Energy Donate to DU
 
hatrack Donating Member (1000+ posts) Send PM | Profile | Ignore Mon Feb-08-10 01:23 PM
Original message
JPL - Antarctic Losing 100 Km3 In Ice Mass Annually Since 2002; Bulk Of Loss In W. Antarctica - AFP


There has been lots of talk lately about Antarctica and whether or not the continent's giant ice sheet is melting. One new paper1, which states there has been less surface melting recently than in past years, has been cited as "proof" that there's no global warming. Other evidence that the amount of sea ice around Antarctica seems to be increasing slightly2-4 is being used in the same way. But both of these data points are misleading.

Gravity data collected from space using NASA's Grace satellite show that Antarctica has been losing more than a hundred cubic kilometers (24 cubic miles) of ice each year since 2002. The latest data reveals that Antarctica is losing ice at an accelerating rate, too. How is it possible for surface melting to decrease, but for the continent to lose mass anyway? The answer boils down to the fact that ice can flow without melting.

Two-thirds of Antarctica is a high, cold desert. Known as East Antarctica, this section has an average altitude of about 2 kilometers (1.2 miles), higher than the American Colorado Plateau. There is a continent about the size of Australia underneath all this ice; the ice sheet sitting on top averages at a little over 2 kilometers (1.2 miles) thick. If all of this ice melted, it would raise global sea level by about 60 meters (197 feet).

But little, if any, surface warming is occurring over East Antarctica. Radar- and laser-based satellite data show a little mass loss at the edges of East Antarctica, which is being partly offset by accumulation of snow in the interior, although a very recent result from the NASA/German Aerospace Center's Gravity Recovery and Climate Experiment (Grace) suggests that since 2006 there has been more ice loss from East Antarctica than previously thought5. Overall, not much is going on in East Antarctica - yet.

EDIT

http://www.spacedaily.com/reports/Is_Antarctica_Melting_999.html
Printer Friendly | Permalink |  | Top
tinrobot Donating Member (1000+ posts) Send PM | Profile | Ignore Mon Feb-08-10 05:41 PM
Response to Original message
1. But the emails proved it ain't happening...
Right?
Printer Friendly | Permalink |  | Top
 
pleah Donating Member (1000+ posts) Send PM | Profile | Ignore Mon Feb-08-10 05:50 PM
Response to Original message
2. K&R
Printer Friendly | Permalink |  | Top
 
Dead_Parrot Donating Member (1000+ posts) Send PM | Profile | Ignore Mon Feb-08-10 05:51 PM
Response to Original message
3. If the mere possibility of EIAS melt doesn't make you you loose sleep...
Edited on Mon Feb-08-10 05:57 PM by Dead_Parrot
...then you aren't paying attention.

The prospect of a non-linear response to - Ooh! Current headline on stuff.co.nz: Brangelina to sue over split claims! <click><click><click><click>


Printer Friendly | Permalink |  | Top
 
phantom power Donating Member (1000+ posts) Send PM | Profile | Ignore Mon Feb-08-10 06:29 PM
Response to Reply #3
4. What's 180ft between friends?
:woohoo:
Printer Friendly | Permalink |  | Top
 
happyslug Donating Member (1000+ posts) Send PM | Profile | Ignore Tue Feb-09-10 02:39 PM
Response to Reply #3
12. But it is a slim possibility, unlike the WAIS
The West Antarctic Ice Sheet (WAIS) has been called the Godzilla of Global Warming, in that unlike the other Ice Sheets, which are grounded above sea level, the WAIS is grounded BELOW sea level. Given that the WAIS is grounded below sea level interaction between it and the ocean occurs, making it subject to a sudden collapse (And I mean sudden, may occur in less then a day). Such a breakup would lead to the grounded ice floating on top of the water increase world wide sea levels about 20 feet within days.

Yes, if the East Antarctic Ice Sheet (EAIS) goes away it will increase world wide seal levels 180 feet, but that will take decades to achieve given the high attitude of the Antarctic Continent AND that it is completely within the Antarctic Circle. For that to occur Global warming will have to be in a run away mode and that may NOT be possible given Peak oil, Peak Natural Gas and Peak Coal (All expected within the next 50 years). Yes if we use Coal as we are using it today we may have 200 years left of coal, but coal use, like oil and natural gas usage is exponential NOT additive i.e. each year we use more and more. The 200 year number is if we only use the coal we use today over the next 200 years, but if we increase usage at the same rate we have for the last 200 years we have less then 50 years left. Thus Global Warming may end do to a lack of carbon to be released do to all fossil fuels being used up BEFORE the EAIS melts. The real problem is the WAIS may NOT wait that long to break up and thus the major concern. The WAIS may break up any year (including this year). The break up will be same time as the Ice Shelves around Antarctica is at their smallest (During the Antarctic end of Summer, which is the Northern Spring around March 21). WAIS may break up anywhere from about now till about April 15th (Through the real threat is more from March 1st to April 15h), by April 15th the Ice Shelves are expanding so the threat ends of a year.

Just a comment that the EAIS is not the threat the WAIS is. Yes the EAIS has 70 % of the fresh water in the World and the WAIS only has just above 10% (The Greenland Ice Sheet has just under 10% the rest of the fresh water is in the other Glaciers, snow, rivers, lakes in the world).
Printer Friendly | Permalink |  | Top
 
Dead_Parrot Donating Member (1000+ posts) Send PM | Profile | Ignore Tue Feb-09-10 04:10 PM
Response to Reply #12
13. It's probability vs impact
The worse something can be, the less the acceptable chance of it happening becomes. To take a current example, the number of jammed Toyota throttles reported is somewhere around 20. The number of vehicles potentially affected is somewhere around 6 million, so the chances of any one vehicle getting the problem is about 1 in 300,000 - but the potential impact for each is high enough to warrant a massive recall.

EAIS breaking up (and yes the whole process would run to decades, maybe centuries) would displace over most of the population, take out a lot of our farmland and wipe out most major cities: We'd be re-building our ports every ten years until the 23rd century. Odds of a million to one would be far too short, and I suspect they're a lot shorter.
Printer Friendly | Permalink |  | Top
 
Nihil Donating Member (1000+ posts) Send PM | Profile | Ignore Wed Feb-10-10 04:47 AM
Response to Reply #12
14. Oh my gawd ... run for your lives!
> if the East Antarctic Ice Sheet (EAIS) goes away
> it will increase world wide seal levels 180 feet


:P
Printer Friendly | Permalink |  | Top
 
happyslug Donating Member (1000+ posts) Send PM | Profile | Ignore Wed Feb-10-10 09:56 AM
Response to Reply #14
16. And Polar bears will be happy, they LOVE Seals
So I typed in an extra l to sea, that is one of the problems with Spell Checks, they do NOT catch misspelled words is the result is a actual word.

Ode to My Spell Checker:

Eye halve a spelling chequer
It came with my pea sea
It planely marques four my revue
Miss steaks eye kin knot sea.
Eye strike a key and tipe a werd
And weight four it two say
Weather eye am wrong oar write
It shows me strait a weigh.
As soon as a mist ache is maid
It nose bee fore two long
And eye can put the error rite
Its rare lea ever wrong.
Eye have run this poem threw it
I am shore your pleased two no
Its letter perfect awl the weigh
My chequer tolled me sew.

http://www.crosswalk.com/fun/computers-internet/1350622/
Among other places on the net

Printer Friendly | Permalink |  | Top
 
Nihil Donating Member (1000+ posts) Send PM | Profile | Ignore Wed Feb-10-10 10:33 AM
Response to Reply #16
17. It just conjured up a delightful image in my mind ...
... moreover, one that was a pleasant contrast to the solemnity
of the subject under discussion ... I couldn't resist!
:pals:
Printer Friendly | Permalink |  | Top
 
OnlinePoker Donating Member (837 posts) Send PM | Profile | Ignore Mon Feb-08-10 09:06 PM
Response to Original message
5. Let's put 100 cubic kilometres in perspective
There are 1000 metres in a kilometre and 100 centimetres in a metre. This means a 10 km x 10 km x 1km square (100 cubic km) sliced into 1 cm levels would stretch out over 10 million square km. Since 2002, this means the total space covered would be 80 mil sq km. The earth's total ocean area is 360 million sq km. In 8 years, the total volume of ice lost from the antarctic is less than 1/4 cm...less than a 10th of an inch. Sorry if I don't see the crisis.
Printer Friendly | Permalink |  | Top
 
Dead_Parrot Donating Member (1000+ posts) Send PM | Profile | Ignore Mon Feb-08-10 09:51 PM
Response to Reply #5
6. Let's put "non-linear" in perspective
Actually, let's not bother. Go move to NOLA, you'll be quite safe.
Printer Friendly | Permalink |  | Top
 
joshcryer Donating Member (1000+ posts) Send PM | Profile | Ignore Tue Feb-09-10 01:48 AM
Response to Reply #5
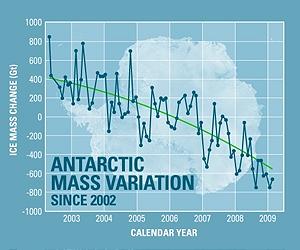
7. See that arc in the projection? Close your eyes and project it outward. It's not a linear problem.
It goes "pow" in a very short period of geologic time.
Printer Friendly | Permalink |  | Top
 
OnlinePoker Donating Member (837 posts) Send PM | Profile | Ignore Tue Feb-09-10 02:00 AM
Response to Reply #7
8. See that period from '02 to '05
The ice mass was growing. The level of growth was decreasing, becoming neutral in '06-'07 and dropping into negative territory in the last 3 years. This could be a blip. We don't know what the mass was doing prior to '02 because we didn't have the instrumentation to gain that knowledge. 8 years of data is insufficient to determine what is happening long term. Look at the following link which is Antarctic sea ice extent. It has remained fairly consistent for the last 30 years, even with ice shelves breaking up.


Printer Friendly | Permalink |  | Top
 
Dead_Parrot Donating Member (1000+ posts) Send PM | Profile | Ignore Tue Feb-09-10 02:39 AM
Response to Reply #8
9. That's a plot of area, not mass (or volume)
You know the difference, I assume?
Printer Friendly | Permalink |  | Top
 
joshcryer Donating Member (1000+ posts) Send PM | Profile | Ignore Tue Feb-09-10 03:30 AM
Response to Reply #9
10. This is a very frequent confusion, and it's sea ice.
It's unsurprising that Antarctic sea ice extent is growing when it is losing so much overall mass.

Take a cup of water and put it in a freezer, it'll freeze over in, say, 30 minutes (just the surface).

Take a cup of water with an ice cube in it, it'll start freezing around the ice cube much sooner, say, within 15 minutes.
Printer Friendly | Permalink |  | Top
 
Dead_Parrot Donating Member (1000+ posts) Send PM | Profile | Ignore Tue Feb-09-10 04:23 AM
Response to Reply #10
11. I give plenty of room for sea/land definitions
Especially in Antarctica where you've got ice grounded below sea-level all over the place: The difference between, say, the Thwaites glacier and the Thwaites ice shelf is mainly down to where the morraine is, and it seems they can shift surprisingly quickly.

But yeah, the ice streams are running thinner and faster giving them more area and less volume. Eventually it will thin enough to let water over the WAIS lip around 77S: That'll be fun to watch.
Printer Friendly | Permalink |  | Top
 
hatrack Donating Member (1000+ posts) Send PM | Profile | Ignore Wed Feb-10-10 09:49 AM
Response to Reply #9
15. Off playing online poker, it would seem; hence unable to respond
Pity . . .

Printer Friendly | Permalink |  | Top
 
Dead_Parrot Donating Member (1000+ posts) Send PM | Profile | Ignore Wed Feb-10-10 02:13 PM
Response to Reply #15
18. Let's hope he's playing with a full deck... nt
Printer Friendly | Permalink |  | Top
 
Nederland Donating Member (1000+ posts) Send PM | Profile | Ignore Wed Feb-10-10 07:03 PM
Response to Reply #7
19. I see the arc
I just wonder why you think it will continue in the direction is currently is going. Are you under the assumption 8 years of data is sufficient to determine the long term trend?
Printer Friendly | Permalink |  | Top
 
DU AdBot (1000+ posts) Click to send private message to this author Click to view 
this author's profile Click to add 
this author to your buddy list Click to add 
this author to your Ignore list Fri Apr 19th 2024, 08:00 PM
Response to Original message
Advertisements [?]
 Top

Home » Discuss » Topic Forums » Environment/Energy Donate to DU

Powered by DCForum+ Version 1.1 Copyright 1997-2002 DCScripts.com
Software has been extensively modified by the DU administrators


Important Notices: By participating on this discussion board, visitors agree to abide by the rules outlined on our Rules page. Messages posted on the Democratic Underground Discussion Forums are the opinions of the individuals who post them, and do not necessarily represent the opinions of Democratic Underground, LLC.

Home  |  Discussion Forums  |  Journals |  Store  |  Donate

About DU  |  Contact Us  |  Privacy Policy

Got a message for Democratic Underground? Click here to send us a message.

© 2001 - 2011 Democratic Underground, LLC