Democratic Underground Latest Greatest Lobby Journals Search Options Help Login
Google

How much wind power would it take to decarbonize the world's economy?

Printer-friendly format Printer-friendly format
Printer-friendly format Email this thread to a friend
Printer-friendly format Bookmark this thread
This topic is archived.
Home » Discuss » Topic Forums » Environment/Energy Donate to DU
 
GliderGuider Donating Member (1000+ posts) Send PM | Profile | Ignore Wed Nov-25-09 11:29 AM
Original message
How much wind power would it take to decarbonize the world's economy?
The gloomy projections of The Copenhagen Diagnosis got me interested in what rate of wind power installation would be required to completely decarbonize the operation of our global civilization within 40 years (by 2050). It was an interesting exercise.

I started with the energy consumption data from the BP Statistical Review of World Energy 2009 spreadsheet. I summed the oil, gas and coal consumption figures (normalized into millions of tonnes of oil equivalent) for each year since 1965. I then calculated how much the fossil fuel consumption had increased annually, on average over that time. It turns out we have used on average 150 mtoe more fossil fuel each year, for a growth rate of about 2.4% per year. I kept a constant growth of 150 mtoe/year in the calculations just so nobody will say I’m trying to immiserate the world.

The Arithmetic

The calculation goes like this: each year we need to replace 1/40th of our current fossil fuel usage, plus the amount required for nominal growth, with a non-carbon source. I chose wind power as the replacement, since it has a lot of nice properties. We use about 10,000 mtoe of fossil fuels per year now, so 1/40th of that is about 250 mtoe. Adding the two together gives us a replacement requirement of 400 million tonnes of oil per year.

Note that using a constant amount for the growth factor gives a declining percentage growth over time, which is at least a step in the right direction.

How much electricity might it take to replace that much oil? The BP spreadsheet contains the handy note that a million tonnes of oil burned in a modern power plant will generate about 4.4 terawatt-hours of electricity, so this is the conversion factor I used. Doing the multiplication shows that we need to produce an additional 1,761,000,000 MWh each year.

That looks big, right? How much wind capacity would it take to produce that much electricity? Well, there are 8760 hours in a year, and a wind turbine has a capacity factor of about 30%, so I divided that number by (8760*3). The outcome is that we need to install 67,000 MW of nameplate capacity every year for the next 40 years to decarbonize the world economy by 2050 and maintain a modest growth in energy use. The world would then contain the equivalent of half a million 5 MW turbines.

The Conclusions

The world installed &title=&w=441&h=252&mode=0&print=0&click=0">20,000 MW of nameplate capacity in 2007, 27,000 in 2008 and maybe 29,000 in 2009. So we’re almost halfway to where we need to be.

The other side of the decarbonisation coin is that we will need to stop using fossil fuels, even when they are available. If we don’t, the addition of all that wind energy would have no effect whatever on the climate trajectory.

Whether this undertaking is politically, economically or socially realistic is a discussion for another day.

Note that this analysis does not address the issues of infrastructure changeout, grid replacement, the social changes necessary to adapt to the new energy sources or any possible influence of improved energy efficiency.
Printer Friendly | Permalink |  | Top
daleanime Donating Member (1000+ posts) Send PM | Profile | Ignore Wed Nov-25-09 11:31 AM
Response to Original message
1. The question is not can it be done....
it's will it be done.:scared:
Printer Friendly | Permalink |  | Top
 
GliderGuider Donating Member (1000+ posts) Send PM | Profile | Ignore Wed Nov-25-09 11:36 AM
Response to Reply #1
3. And remember that it needs to be done everywhere.
The USA, China, India, Africa, Australia. The variations in national political and social climates may keep us from dealing with the global physical climate.
Printer Friendly | Permalink |  | Top
 
The2ndWheel Donating Member (1000+ posts) Send PM | Profile | Ignore Wed Nov-25-09 12:13 PM
Response to Reply #3
6. Diversity or uniformity
It's a local world, or a global world. It can't be both. Those variations either exist, or we get rid of them. They can't exist and be gotten rid of.

If something needs to be done everywhere, then variations must be eliminated. For example, the names of countries. The USA, China, India, Africa, Australia, these words can't mean anything if variation cannot exist.
Printer Friendly | Permalink |  | Top
 
slackmaster Donating Member (1000+ posts) Send PM | Profile | Ignore Wed Nov-25-09 11:32 AM
Response to Original message
2. I think Congress could provide sufficient hot air to get the job done
If only we had the technology to harvest it.
Printer Friendly | Permalink |  | Top
 
Bitwit1234 Donating Member (1000+ posts) Send PM | Profile | Ignore Wed Nov-25-09 12:25 PM
Response to Reply #2
7. Gee some bright soul always takes my ideas...I agree I agree
Printer Friendly | Permalink |  | Top
 
OKIsItJustMe Donating Member (1000+ posts) Send PM | Profile | Ignore Wed Nov-25-09 11:46 AM
Response to Original message
4. Why would you assume that a single source (i.e. wind) would be used to “decarbonize?”
However, just for a moment, let’s think that way. Here’s a plan which should be of interest:

http://www1.eere.energy.gov/windandhydro/wind_2030.html

20% Wind Energy by 2030: Increasing Wind Energy's Contribution to U.S. Electricity Supply

Here you will find the description of the "20% Wind Energy by 2030" report, which was recently published by the U.S. Department of Energy, and related materials and workshops.


Achieving 20% wind energy will require the number of turbine installations to increase from approximately 2000 per year in 2006 to almost 7000 per year in 2017.


In essence, we’re talking about supply 20% of US electrical demands in 20 years. (Presumably, at the same pace one could provide 100% of US electrical demands in 100 years.)

However, I tend to view wind power as a stand-in while solar is better developed and (hopefully) fusion.
Printer Friendly | Permalink |  | Top
 
DCKit Donating Member (1000+ posts) Send PM | Profile | Ignore Wed Nov-25-09 12:09 PM
Response to Reply #4
5. It was a mathmatical exercise on the amount of windpower it would take...
not a comprehensive review of all our options. Just think of what we could accomplish if we did all this with wind, then used solar as the icing on the cake to power our next industrial revolution.

Now you do the same with solar (though I believe it's already been done - 240 sq. miles of the SW) and the rest of us here in E&E will do our best to push the full development of both and our collective resurgence as the dominant manufacturing power in the world.
Printer Friendly | Permalink |  | Top
 
OKIsItJustMe Donating Member (1000+ posts) Send PM | Profile | Ignore Wed Nov-25-09 04:32 PM
Response to Reply #5
21. I believe you misunderstand me
Edited on Wed Nov-25-09 04:34 PM by OKIsItJustMe
It seemed to me that doing the calculation this way (looking at wind only) is like fighting with one (or more) hands tied behind your back. Naturally, the calculation is easier if only one form of “renewable” power is considered.

I actually advocate the continued development of wind power, and geothermal power and wave power and…

At this time, wind power gives the greatest "bang for the buck." I just happen to feel that over time, solar will replace wind, and (hopefully) one day, fusion will replace solar.
Printer Friendly | Permalink |  | Top
 
joshcryer Donating Member (1000+ posts) Send PM | Profile | Ignore Wed Nov-25-09 08:34 PM
Response to Reply #21
46. I want to see a paper on the worlds best wind locations and how big they are.
13% of Jacobson's measured wind stations meet his criteria for 3 rank or higher. Where are they and what area do they cover? I don't see this immediately available.
Printer Friendly | Permalink |  | Top
 
Nederland Donating Member (1000+ posts) Send PM | Profile | Ignore Wed Nov-25-09 12:50 PM
Response to Original message
8. You'd need more than that
Edited on Wed Nov-25-09 12:51 PM by Nederland
My understanding is that wind turbines have a lifetime of 20 years. That means by the end of your 40 year period, you need to be able to replace 134,000 MW of nameplate capacity every year just to maintain your turbines.
Printer Friendly | Permalink |  | Top
 
GliderGuider Donating Member (1000+ posts) Send PM | Profile | Ignore Wed Nov-25-09 01:18 PM
Response to Reply #8
9. Good catch.
I'd forgotten the life cycle. The additional strain would start in year 20 of the program (when the turbines installed in the first year aged out). Since the build rate is constant, the build rate would double to 134,000 MW at the end of 20 years, and would then remain constant at that rate in perpetuity.

That only gets us a steady state system, though. If we wanted to maintain that 150 mtoe/year of growth that I factored into the original plan, that would require an additional 25,000 MW of capacity per year for the first 20 years after the replacement was complete, 50,000 for the next 20, 75,000 for the 20 after that... So by 2100 we'd be building over 200,000 MW of turbines a year just to stay even and give the economy a growth cushion of 2% or so.

By 2100 there'd be about 750,000 big (5MW) turbines in the world, and we'd be building and reinstalling 40,000 a year or 100 a day.
Printer Friendly | Permalink |  | Top
 
joshcryer Donating Member (1000+ posts) Send PM | Profile | Ignore Wed Nov-25-09 02:31 PM
Response to Reply #9
11. Now calculate materials.
:hi:
Printer Friendly | Permalink |  | Top
 
GliderGuider Donating Member (1000+ posts) Send PM | Profile | Ignore Wed Nov-25-09 02:33 PM
Response to Reply #11
13. Ah, you really want me to put the cat among the pigeons, eh?
Printer Friendly | Permalink |  | Top
 
GliderGuider Donating Member (1000+ posts) Send PM | Profile | Ignore Wed Nov-25-09 03:13 PM
Response to Reply #13
14. Well, a big turbine needs 2000 tonnes of concrete or more
This site says 2800 tonnes of concrete for a 5 MW offshore installation. Tower/nacelle/rotor weights seem to be around 100 tonnes of steel per MW, so 500 tonnes for a 5 MW turbine.

750,000 turbines would consume 2 billion tonnes of concrete and close to half a billion tonnes of steel.

The world produces about 2 billion tonnes of cement and 1.3 billion tonnes of steel a year.

It seems materials would be a manageable issue, as the demand would be spread out over 40 years. Logistics and finance, however????
Printer Friendly | Permalink |  | Top
 
kristopher Donating Member (1000+ posts) Send PM | Profile | Ignore Wed Nov-25-09 02:13 PM
Response to Original message
10. A couple of points
First is the omission of energy efficiency in the industrialized world. There is a lot of room for improvement and your calculation must incorporate the variable. For example, replacing petroleum for personal transport with EVs will make a dramatic difference in kwh/mile and therefore in total energy demand.

Second is the use of a 30% capacity factor. That number is probably low. It may accurately reflect an average of wind installed to date, but since the forecasting technologies and site planning have improved dramatically, I'd recommend using 33% for terrestrial based and 44% for offshore wind. Those are the standard assumptions being used going forward.

I agree with the use of 5 MW turbines but you should be aware that larger turbines are in the works (up to 10MW) for offshore while terrestrial looks to max out at about 5 because of transportation constraints.

Putting the final number in perspective by comparing it to other large scale manufacturing endeavors such as cars or weapons platforms during WW2 is also helpful.


Printer Friendly | Permalink |  | Top
 
GliderGuider Donating Member (1000+ posts) Send PM | Profile | Ignore Wed Nov-25-09 02:32 PM
Response to Reply #10
12. I think this is close enough to make the point.
The conversion factor I used for fossil to electricity (4.4 MWh/tonne for electricity as opposed to 12 MWh/tonne for thermal content) already takes care of much of the efficiency question.

30% to 33% doesn't make a bit of difference in a calculation like this, and it's arguable that some of those 750,000 big turbines may be located in suboptimal areas due to political pressures or geographic realities. Not every place that needs electricity has access to well-situated coastline. I'd bet that an aggregate CF of 30% is close to reality.

My goal was something simple and not too misleading to show the scale of the problem. Comparisons to Apollo/WWII/building the US freeway system get bogged down in political feasibility debates. Not interested.
Printer Friendly | Permalink |  | Top
 
kristopher Donating Member (1000+ posts) Send PM | Profile | Ignore Wed Nov-25-09 03:35 PM
Response to Reply #12
15. I disagree; you are off by a wide margin.
As usual.

If you are going to use wind then use the data that is out there regarding wind; just fucking making shit up and pretending it is meaningful is the same thing you used to do with your doomer scenarios.
Printer Friendly | Permalink |  | Top
 
joshcryer Donating Member (1000+ posts) Send PM | Profile | Ignore Wed Nov-25-09 03:45 PM
Response to Reply #15
16. You are correct, his numbers are a extremely optimistic. 750k turbines vs Jacobons 3.8 mil.
And that's just to power 51%. So yes, way way way off.

It would be easier to just do Jacobon's numbers.
Printer Friendly | Permalink |  | Top
 
kristopher Donating Member (1000+ posts) Send PM | Profile | Ignore Wed Nov-25-09 04:32 PM
Response to Reply #16
22. If you still have it please post the link to that download.
Edited on Wed Nov-25-09 04:37 PM by kristopher
It would be a valuable addition to the discussion.

ETA: that's because even the 3.8 million is with considerable other generation to help.

Printer Friendly | Permalink |  | Top
 
GliderGuider Donating Member (1000+ posts) Send PM | Profile | Ignore Wed Nov-25-09 04:41 PM
Response to Reply #16
27. What size of turbine did Jacobson use in his analysis?
I'm talking 5 MW units. If Jacobson based his calculations on 1.5 MW we're not far apart. The issue for this analysis is how much electricity you need to generate in total, not turbine size.

I'm also talking about building and installing 750,000 units that are equivalent to the some of the largest in the world today, that are currently being installed mostly offshore. And I'm talking about putting them on land as well as in the oceans. This is heap big juju.
Printer Friendly | Permalink |  | Top
 
joshcryer Donating Member (1000+ posts) Send PM | Profile | Ignore Wed Nov-25-09 04:52 PM
Response to Reply #27
31. 5 MW units. Link to the PDF here:
http://www.stanford.edu/group/efmh/jacobson/sad1109Jaco5p.indd.pdf

He assumes 2030 but you of course can assume 2050, just extrapolate the figures a bit.

Here is his page about it: http://www.stanford.edu/group/efmh/jacobson/susenergy2030.html

And this has how he calculates the lower bound for energy usage (since all electric is more efficient): http://www.stanford.edu/group/efmh/jacobson/WindWaterSun1009.pdf

If you do extrapolate to 2050 you will have to consider energy growth from 2030 to 2050, so it'd be much easier to just go by 2030, though admittedly the construction levels would be crazy (but not insurmountable for our species).
Printer Friendly | Permalink |  | Top
 
kristopher Donating Member (1000+ posts) Send PM | Profile | Ignore Wed Nov-25-09 04:53 PM
Response to Reply #27
32. 5MW
Printer Friendly | Permalink |  | Top
 
joshcryer Donating Member (1000+ posts) Send PM | Profile | Ignore Wed Nov-25-09 07:07 PM
Response to Reply #27
38. If you wanted, you could double his wind, however, his plan takes advantage of daily natural power.
So in the day time you use photovoltaic and solar thermal, at night you use wind.

If you were to double his numbers, to be fair you would have to include a storage system to store the nights extra energy during the day, which itself would be a massive undertaking.

That's the beauty of this plan, it doesn't need significant storage, just a proper implementation.
Printer Friendly | Permalink |  | Top
 
GliderGuider Donating Member (1000+ posts) Send PM | Profile | Ignore Wed Nov-25-09 07:06 PM
Response to Reply #16
37. I found Jacobson's error.
Edited on Wed Nov-25-09 07:11 PM by GliderGuider
He is proposing to replace the thermal energy of fossil fuels joule for joule with electricity generated from wind turbines. That's not correct, because as everyone tirelessly points out, the use of electricity, especially in transportation, is vastly more efficient than combustion. Most of the thermal energy Jacobson is proposing to replace is wasted energy, whether in vehicles or power plants. Under an all-electrical regime the efficiency is so much higher that you don't need nearly as much primary energy to do the same work.

This is precisely why I used the conversion factor of 4.4 MWh/toe as provided by BP rather than the 12 MWh/toe that Jacobson uses.

Jacobson has made the problem bigger than it is by a factor of three.

3.8 million 5MW turbines. Wanker.
Printer Friendly | Permalink |  | Top
 
kristopher Donating Member (1000+ posts) Send PM | Profile | Ignore Wed Nov-25-09 07:07 PM
Response to Reply #37
39. Care to provide a reference?
Printer Friendly | Permalink |  | Top
 
joshcryer Donating Member (1000+ posts) Send PM | Profile | Ignore Wed Nov-25-09 07:18 PM
Response to Reply #39
41. He's saying Jacobson's fossil to renewable efficiencies are wrong.
But they're not wrong because we know that energy statistics come in raw BTU. If there existed statistics that took into account inefficiencies of fossil fuel utilization, then of course the numbers would be similar to Jacobson's renewable analysis.

Note, that coal plant that is 35% efficient cannot thermodynamically be very much more efficient. So by design all of that waste heat is necessary and part of the operating function of the plant.
Printer Friendly | Permalink |  | Top
 
joshcryer Donating Member (1000+ posts) Send PM | Profile | Ignore Wed Nov-25-09 07:24 PM
Response to Reply #39
42. pp 31 is what GG missed:
From Evaluating the Feasibility of a Large-Scale Wind, Water, and Sun Energy Infrastructure (I posted it in that link a few posts up), pp 31:

Projected total world and total U. S. power for all energy end uses in the year 2030, in the conventional or business-as-usual scenario relying primarily on fossil fuels. The projections are from the EIA International Energy Outlook 2008 (2008a); we converted from BTUs per year to Watts. The breakdown here is by type of energy in end use; thus, “renewables” here refers, for example, to end-use combustion of biomass, such as wood used for heating.


If you converted fossil fuels to watts, it'd still be the same, it would take some other analysis to strip out fossil inefficiency.
Printer Friendly | Permalink |  | Top
 
GliderGuider Donating Member (1000+ posts) Send PM | Profile | Ignore Wed Nov-25-09 08:04 PM
Response to Reply #39
45. The data you need is here
Edited on Wed Nov-25-09 08:56 PM by GliderGuider
EIA primary energy consumption (XLS)
BP Statistical Review of World Energy 2009 (XLS)
Conversion of quads to TWh

According to the EIA Table 18 in the first link, total world primary energy consumption in 2006 was 472 quads. At 293 TWh/quad and 8760 hours/year that comes out to 15.8 TW. Cool.
The fossil fuel portion of that table comes out to 407 quads, or 119,000 TWh.
From the BP table in the second link we find that the total fossil fuel consumption (oil, NG and coal all normalized to mtoe) for 2006 was 9502 mtoe.
Now the thermal energy of 1 toe is about 12 TWh. so 12*9502= 114,000 TWh.

114,000 is near enough to 119,000 to write the discrepancy off to data-gathering techniques (EIA and BP would have different sources and methodologies). It's clear that the 15 TW figure was derived using the thermal energy content of fossil fuels, with no allowance for the actual work done.

The electricity required to replace the work done/electricity produced by fossil fuels with wind-generated electricity would be much lower because of the higher efficiency of electricity. BP gives a conversion efficiency of 4.4 TWh/toe for electricity rather than the 12 TWh/toe of thermal energy. Thhis seems more realistic.

If we leave all the other energy sources in the BP worksheet untouched and just replace the fossil fuels with electricity at the 4.4 TWh/toe conversion, the world today would only need on the order of 6 TW instead of 15.

Jacobson screwed up.

On edit: Corrected a couple of GWh vs. TWh mistypes.
Printer Friendly | Permalink |  | Top
 
joshcryer Donating Member (1000+ posts) Send PM | Profile | Ignore Wed Nov-25-09 09:04 PM
Response to Reply #45
48. That's simply not true, read Appendix A.1.
You look at an industrial process that isn't electrified, such as glass smelting, every bit of natural gas that goes into the process is literally used in the process, it is extremely BTU efficient, the walls of a smelter are several feet thick, composed of ceramics, and the heat only escapes significantly from the doors when glass is inserted. Indeed, in some smelters they run 24/7 because if they were allowed to cool the ceramics would break and the smelter would have to be replaced. There are some which have been running for decades.

This is why Jacobson breaks down the various industrial and commercial processes and weights them separately. Of course the more you weight these things the higher the number comes out, but it's also more accurate. By assuming *all processes have some constant efficiency* as you are doing here, you wind up with a very low balled estimate.

Just to illustrate further, for residential CO2 emissions, natural gas produces more CO2 than coal*, why? Because natural gas is used by millions of Americans for heating and cooking. For heating and cooking it is extremely efficient, though. Every joule used in natural gas for a hot water heater, in modern designs, is used to heat the water.

(*Coal obviously emits more CO2 than natural gas when viewed as a whole, I am speaking residential sector alone. The commercial industrial sector emits magnitudes more CO2 than residential.)
Printer Friendly | Permalink |  | Top
 
GliderGuider Donating Member (1000+ posts) Send PM | Profile | Ignore Wed Nov-25-09 10:16 PM
Response to Reply #48
49. OK, I've reconsidered the issue.
Edited on Wed Nov-25-09 10:35 PM by GliderGuider
70% of oil is used for transportation, so for that fraction we need a conversion factor of about 30% (assuming that most vehicle transportation is 3 times as efficient as using oil). The remainder is assumed to require conversion at 100%.

About 50% of NG is used for process heat (100% conversion), 50% for electrical generation at 50% efficiency.

Coal is used mostly for electricity generation with a thermal efficiency of about 40%.

So to convert today's requirements we need 2000 mtoe of oil, about 2000 mtoe of gas and 1300 mtoe of coal.

That totals to 5300 mtoe(thermal) at 12 TWh/toe or 7.3 TW. That would take about 4.4 million 5 MW turbines to replace today's fossil fuel use.

So the wanker was right. Sorry about that, Dr. J.

To do that by 2030 would require building 200,000 turbines a year. Even worse than I suspected.

Thanks, guys.

Printer Friendly | Permalink |  | Top
 
joshcryer Donating Member (1000+ posts) Send PM | Profile | Ignore Thu Nov-26-09 02:23 AM
Response to Reply #49
50. Yeah, the scale of this is pretty amazing. But it'd take WWII level manufacturing.
Possibly even WWII + WWI combined. I am tellin' ya, we aren't going to solve this before we hit 4.0C at the bare minimum, I am thinking more like 5.0C. The scientists suggest even 6.0C is possible.

We're already seeing that 1.5C is causing significant, unforeseen dynamical ice flow. It just shows how poor our knowledge of the situation really was. 2.0C as a metric was just arbitrary, imo. Once heating was discernible from noise and Hansen's model was proven correct, we should have fucking went crazy to fix this.
Printer Friendly | Permalink |  | Top
 
GliderGuider Donating Member (1000+ posts) Send PM | Profile | Ignore Thu Nov-26-09 05:32 AM
Response to Reply #50
51. I agree.
The problem is, we'd have to have already started the work, and we haven't.
Printer Friendly | Permalink |  | Top
 
joshcryer Donating Member (1000+ posts) Send PM | Profile | Ignore Wed Nov-25-09 07:15 PM
Response to Reply #37
40. He's only showing that the BTU used to run fossil civilization is higher than that to run renewable.
Since energy statistics come in raw BTU, it's the only reasonable way to do it. I mean, he could strip the thermal inefficiency from current (or 2030) civilization, however, that's not really fair since when you do burn that gallon of gasoline 60% of its energy is lost to heat.
Printer Friendly | Permalink |  | Top
 
kristopher Donating Member (1000+ posts) Send PM | Profile | Ignore Wed Nov-25-09 07:32 PM
Response to Reply #40
43. GG is probably wrong
Edited on Wed Nov-25-09 07:44 PM by kristopher
Plenty of SUPPLY

Today the maximum power consumed worldwide at any given moment is about 12.5 trillion watts (terawatts, or TW), according to the U.S. Energy Information Administration. The agency projects that in 2030 the world will require 16.9 TW of power as global population and living standards rise, with about 2.8 TW in the U.S. The mix of sources is similar to today’s, heavily dependent on fossil fuels. If, however, the planet were powered entirely by WWS, with no fossil-fuel or biomass combustion, an intriguing savings would occur. Global power demand would be only 11.5 TW, and U.S. demand would be 1.8 TW. That decline occurs because, in most cases, electrifi cation is a more efficient way to use energy. For example, only 17 to 20 percent of the energy in gasoline is used to move a vehicle (the rest is wasted as heat), whereas 75 to 86 percent of the electricity delivered to an electric vehicle goes into motion.
p.60


But GG isn't a wanker.
Printer Friendly | Permalink |  | Top
 
joshcryer Donating Member (1000+ posts) Send PM | Profile | Ignore Wed Nov-25-09 07:46 PM
Response to Reply #43
44. Appendix A.1 has all of the equations, they are admittedly simplistic, but it's still a good gauge.
He does note, for instance, how BTU in industrial processes is used directly and more efficiently.
Printer Friendly | Permalink |  | Top
 
GliderGuider Donating Member (1000+ posts) Send PM | Profile | Ignore Wed Nov-25-09 08:53 PM
Response to Reply #44
47. One of you guys should address my calculations above.
Edited on Wed Nov-25-09 08:57 PM by GliderGuider
http://www.democraticunderground.com/discuss/duboard.php?az=show_mesg&forum=115&topic_id=218612&mesg_id=218725

If you can demonstrate I'm wrong using logic and numbers, I will admit it.
Printer Friendly | Permalink |  | Top
 
Terry in Austin Donating Member (1000+ posts) Send PM | Profile | Ignore Wed Nov-25-09 03:47 PM
Response to Original message
17. The power of arithmetic
It's as stark, compelling and informative as it is little-used. Thanks, GG!

Your power calculations readily translate to mill-count and land use. At 5 MW per unit, 67,000 MW of new capacity per year means 13,400 new units. As each unit needs about 10 acres, or about 10.6 per square mile, that gives a total required area of 1256 square miles. We can even sprinkle in a few cattle grazing among the towers.

We all know it's a long way from the back of the envelope to gear on the ground, but it serves to give us a sober sense of the scale involved. As noted upthread, on-the-ground solutions will no doubt be a mix that includes solar, which has some sobering arithmetic of its own -- 205,000 square miles of 15% efficient flat-plate PV for a solar-only scenario, according to one analysis I've seen.

Getting from policy to implementation, well -- it's the old gag question: "How do you get six elephants into a Volkswagen?" Answer: "Three in the front, three in the back."

Of course, achieving even a half or a third of this scale will be remarkable, and a testament to our current paradigm of "heroic industrialism." Seeing how well the paradigm serves us in gettting through the upcoming shift will be interesting -- as in "interesting times."


Printer Friendly | Permalink |  | Top
 
kristopher Donating Member (1000+ posts) Send PM | Profile | Ignore Wed Nov-25-09 04:04 PM
Response to Reply #17
18. GIGO
Edited on Wed Nov-25-09 04:10 PM by kristopher
This is a graphic of the area each technology would require to power the US personal transportation fleet of electric drive vehicles:


Most of the wind for a global buildout is forecast to be offshore. This is the abstract for a somewhat more comprehensive 50+ page analysis of the issue.

Evaluation of Global Wind Power

Cristina L. Archer and Mark Z. Jacobson
Department of Civil and Environmental Engineering, Stanford University, Stanford, CA
14 March 2005

Abstract.
The goal of this study is to quantify the world’s wind power potential for the first time.
Wind speeds are calculated at 80 m, the hub height of modern, 77-m diameter, 1500 W
turbines. Since relatively few observations are available at 80 m, the Least Square
extrapolation technique is utilized and revised here to obtain estimates of wind speeds at
80 m given observed wind speeds at 10 m (widely available) and a network of sounding
stations. Tower data from the Kennedy Space Center (Florida) were used to validate the
results. Globally, ~13% of all reporting stations experience annual mean wind speeds
6.9 m/s at 80 m (i.e., wind power class 3 or greater) and can therefore be considered
suitable for low-cost wind power generation. This estimate is believed to be conservative.

Of all continents, North America has the largest number of stations in class (453) and
Antarctica has the largest percent (60%). Areas with great potential are found in Northern
Europe along the North Sea, the southern tip of the South American continent, the island
of Tasmania in Australia, the Great Lakes region, and the northeastern and northwestern
coasts of North America. The global average 10-m wind speed over the ocean from
measurements is 6.64 m/s (class 6); that over land was 3.28 m/s (class 1). The calculated
80-m values are 8.60 m/s (class 6) and 4.54 m/s (class 1) over ocean and land,
respectively. Over land, daytime wind speed averages obtained from soundings (4.96 m/s)
are slightly larger than nighttime ones (4.85 m/s); nighttime wind speeds increase, on
average, above daytime speeds above 120 m. Assuming that statistics generated from all
stations analyzed here are representative of the global distribution of winds, global wind
power generated at locations with mean annual wind speeds 6.9 m/s at 80 m is found to
be ~72 TW (~54,000 Mtoe) for the year 2000. Even if only ~20% of this power could be
captured, it could satisfy 100% of the world’s energy demand for all purposes
(6995-10177 Mtoe) and over seven times the world’s electricity needs (1.6-1.8 TW).
Several practical barriers need to be overcome to fully realize this potential.


That is where you *start* to calculate how many would be needed.
Printer Friendly | Permalink |  | Top
 
joshcryer Donating Member (1000+ posts) Send PM | Profile | Ignore Wed Nov-25-09 04:27 PM
Response to Reply #18
19. That graphic doesn't disagree with his statement.
Printer Friendly | Permalink |  | Top
 
kristopher Donating Member (1000+ posts) Send PM | Profile | Ignore Wed Nov-25-09 04:30 PM
Response to Reply #19
20. It's the difference between
a half truth and the whole truth.

As such it DOES disagree with his statement in the sense that a half truth conveys a meaning that is refuted by the whole truth.
Printer Friendly | Permalink |  | Top
 
joshcryer Donating Member (1000+ posts) Send PM | Profile | Ignore Wed Nov-25-09 04:33 PM
Response to Reply #20
23. The whole truth with a graphic that only considers vehicle power?
Are you seriously trying to pull that? Seriously?
Printer Friendly | Permalink |  | Top
 
kristopher Donating Member (1000+ posts) Send PM | Profile | Ignore Wed Nov-25-09 04:39 PM
Response to Reply #23
26. Land use.
Land use.

Land use.
Printer Friendly | Permalink |  | Top
 
joshcryer Donating Member (1000+ posts) Send PM | Profile | Ignore Wed Nov-25-09 04:47 PM
Response to Reply #26
29. I don't think he misrepresented land or area use figures.
10 acres per 5MW turbine is about right. OK so a lot of it is over water, it's still a big area. It matters little. The scale of these projects is still interesting to think about.
Printer Friendly | Permalink |  | Top
 
kristopher Donating Member (1000+ posts) Send PM | Profile | Ignore Wed Nov-25-09 04:52 PM
Response to Reply #29
30. It matters.
The number he gave is spacing, not actual land used. Wind is very popular precisely because it affords dual use of land that is beneficial to farmers since it augments their income handsomely with very little impact on their agricultural output. The scale of the difference is illustrated in the graphic.
Printer Friendly | Permalink |  | Top
 
joshcryer Donating Member (1000+ posts) Send PM | Profile | Ignore Wed Nov-25-09 04:53 PM
Response to Reply #30
33. And yet no where did he imply that the land would not be usable under the turbines.
:shrug:
Printer Friendly | Permalink |  | Top
 
kristopher Donating Member (1000+ posts) Send PM | Profile | Ignore Wed Nov-25-09 04:55 PM
Response to Reply #33
34. Actually he did.
The meaning of "implication" is that it isn't expressly stated. The claim was obviously meant to convey a large penalty associated with land use.
Printer Friendly | Permalink |  | Top
 
joshcryer Donating Member (1000+ posts) Send PM | Profile | Ignore Wed Nov-25-09 04:57 PM
Response to Reply #34
35. The only "penalty" a reasonable person could envision is a horizon scattered with turbines.
Now, I admit, I have met primitivists who find such ideas repugnant, and they even expressed a desire to do "direct action" on windmills if they obstructed their view, however, these people are in an extreme minority.

What was being conveyed was simply scale.
Printer Friendly | Permalink |  | Top
 
kristopher Donating Member (1000+ posts) Send PM | Profile | Ignore Wed Nov-25-09 05:02 PM
Response to Reply #35
36. I just reread the original
Edited on Wed Nov-25-09 05:02 PM by kristopher
post by Terry.

You are right; I stand corrected.
Printer Friendly | Permalink |  | Top
 
GliderGuider Donating Member (1000+ posts) Send PM | Profile | Ignore Wed Nov-25-09 04:34 PM
Response to Reply #18
24. I'm talking about decarbonizing the entire economy, not just the transportation sector.
That includes both replacing all global transportation with electrical propulsion and replacing all FF electrical generation with wind.
Printer Friendly | Permalink |  | Top
 
kristopher Donating Member (1000+ posts) Send PM | Profile | Ignore Wed Nov-25-09 04:38 PM
Response to Reply #24
25. Yes, I know.
That was to address terry's point of land use.

josh has given a concrete indication of just how far off you are.
Printer Friendly | Permalink |  | Top
 
GliderGuider Donating Member (1000+ posts) Send PM | Profile | Ignore Wed Nov-25-09 04:46 PM
Response to Reply #25
28. Actually josh hasn't.
There has been nothing yet presented in this thread that contradicts my conclusions, except for josh's helpful reminder to consider life cycle management.
Printer Friendly | Permalink |  | Top
 
excess_3 Donating Member (1000+ posts) Send PM | Profile | Ignore Thu Nov-26-09 09:10 AM
Response to Original message
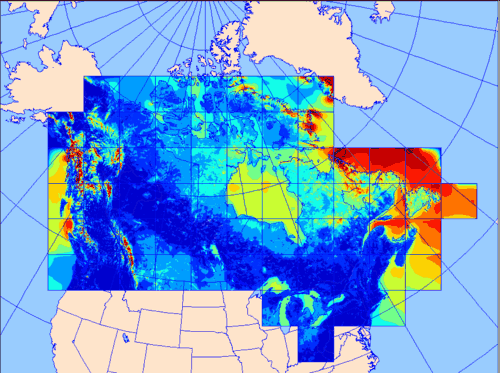
52. is there some reason that wind turbines don't work in Canada? .n
Printer Friendly | Permalink |  | Top
 
GliderGuider Donating Member (1000+ posts) Send PM | Profile | Ignore Thu Nov-26-09 09:26 AM
Response to Reply #52
53. It's not all that windy up here.
At least, not close to most of our population centers. We have good conditions off the East Coast and in the Rockies (I have a friend who is on the board of directors of a new wind farm in BC) but most of our population centers like Toronto, Montreal, Winnipeg, Calgary and Edmonton are in "suboptimal" locations for wind. Most of our population is in a 200 mile wide corridor along the US border going from the St. Lawrence river across the prairies, and the wind there is nice and gentle.

Printer Friendly | Permalink |  | Top
 
excess_3 Donating Member (1000+ posts) Send PM | Profile | Ignore Thu Nov-26-09 09:49 AM
Response to Reply #53
54. I wouldn't think the US is any windier..
Edited on Thu Nov-26-09 10:01 AM by excess_3
it is dead calm outside, btw
Printer Friendly | Permalink |  | Top
 
GliderGuider Donating Member (1000+ posts) Send PM | Profile | Ignore Thu Nov-26-09 10:43 AM
Response to Reply #54
55. Ther USA is in a better position than Canada
Although your interior wind situation sucks as well, much of your population lives in regions with very good wind conditions (i.e. near the East and West coasts). That applies to maybe 15% of Canada's population.
Printer Friendly | Permalink |  | Top
 
DU AdBot (1000+ posts) Click to send private message to this author Click to view 
this author's profile Click to add 
this author to your buddy list Click to add 
this author to your Ignore list Fri Apr 19th 2024, 03:12 PM
Response to Original message
Advertisements [?]
 Top

Home » Discuss » Topic Forums » Environment/Energy Donate to DU

Powered by DCForum+ Version 1.1 Copyright 1997-2002 DCScripts.com
Software has been extensively modified by the DU administrators


Important Notices: By participating on this discussion board, visitors agree to abide by the rules outlined on our Rules page. Messages posted on the Democratic Underground Discussion Forums are the opinions of the individuals who post them, and do not necessarily represent the opinions of Democratic Underground, LLC.

Home  |  Discussion Forums  |  Journals |  Store  |  Donate

About DU  |  Contact Us  |  Privacy Policy

Got a message for Democratic Underground? Click here to send us a message.

© 2001 - 2011 Democratic Underground, LLC