One of the favorite arguments of climate-change deniers is but it was warmer in the late 90s. In fact, the odds are good that Ill get that argument from George Will on This Weak tomorrow. I basically know the answer: temperature is a noisy time series, so if you pick and choose your dates over a short time span you can usually make whatever case you want. Thats why you need to look at longer trends and do some statistical analysis. But I thought that it would be a good thing to look at the data myself.
So heres average annual global temperature since 1880, shown as .01 degrees C deviation from the 1951-80 average.
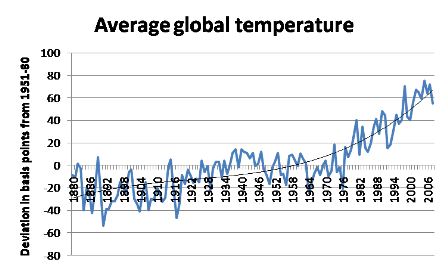
What this tells me is that annual temperature is indeed noisy: there have been many large fluctuations, indeed much larger than the up-and-down in the last decade or so. But the direction of change is unmistakable if you take the longer view. The fitted line in the figure is a 3rd-degree polynomial, but any sort of smoothing would tell you that there is a massive upward trend.
Of course, trend-spotting is no substitute for causal modeling; and the models are getting truly scary in their implications.
-----------
Krugman went a bit further on it today:
Another note on short-term pseudo-trends
As I noted in my previous post, a lot of climate-change denial rests on spurious short-term comparisons: you pick a warm recent year, say 1998, and say well, the trend has been down since then.
If you want a simple analogy to see why thats wrong, consider daily temperatures over the course of a year. Heres data on average daily temperatures in NYC. If you look at the months of April and May, you find that the warmest day was April 26. So clearly its nonsense to say that New Yorks weather is getting warmer as we move into summer
.
http://krugman.blogs.nytimes.com/2009/06/27/another-note-on-short-term-pseudo-trends/Sadly, when it come to the cult of denialism- this sort of reasoning falls on deaf ears.