Gun Control & RKBA
Related: About this forumThe FBI violence stats for 2013 are out.
I'm particularly interested in Table 20, Murder by State and Type of Weapon, because of its relevance to rifle and magazine bans. For percentages, go here, download the Excel version, and sum the columns.
Murder, by State and Type of Weapon, 2013 (FBI)
[font face="courier new"]Total murders...................... 12,253
Handguns............................ 5,782 (47.2%)
Firearms (type unknown)............. 2,079 (17.0%)
Clubs, rope, fire, etc.............. 1,622 (13.2%)
Knives and other cutting weapons.... 1,490 (12.2%)
Hands, fists, feet.................... 687 (5.6%)
Shotguns.............................. 308 (2.5%)
Rifles................................ 285 (2.3%)[/font]
2012 and 2010, for comparison:
Murder, by State and Type of Weapon, 2012 (FBI)
[font face="courier new"]Total murders...................... 12,711
Handguns............................ 8,813 (49.9%)
Firearms (type unknown)............. 1,848 (14.5%)
Clubs, rope, fire, etc.............. 1,637 (12.9%)
Knives and other cutting weapons.... 1,583 (12.5%)
Hands, fists, feet.................... 678 (5.3%)
Rifles................................ 320 (2.5%)
Shotguns.............................. 302 (2.4%)[/font]
Murder, by State and Types of Weapons, 2010 (FBI)
[font face="courier new"]Total murders...........................12,996
Handguns.................................6,009 (46.2%)
Firearms (type unknown)..................2,035 (15.7%)
Clubs, rope, fire, etc...................1,772 (13.6%)
Edged weapons............................1,704 (13.1%)
Hands, feet, etc...........................745 (5.7%)
Shotguns...................................373 (2.9%)
Rifles.....................................358 (2.8%)[/font]
The 9-year trend in rifle homicides, 2005-2013:
[font face="courier new"]2005: 442
2006: 436
2007: 450
2008: 375
2009: 348
2010: 358
2011: 323
2012: 302
2013: 285[/font]
And it's not just rifle homicide that's down over the years; *all* homicide is down over the last decade, even those by fists and feet. Good news all around. The declines in individual categories are probably exaggerated a little by the growth in the "type unknown" category (apparently some departments didn't get their paperwork in...) but the overall totals are down so the declines are real, just a little smaller than the raw category numbers would suggest.
 = new reply since forum marked as read
Highlight:
NoneDon't highlight anything
5 newestHighlight 5 most recent replies
= new reply since forum marked as read
Highlight:
NoneDon't highlight anything
5 newestHighlight 5 most recent replies

Jackpine Radical
(45,274 posts)It's not clear yet whether an uptick is underway, however.

benEzra
(12,148 posts)Fingers crossed that the trend continues. Honestly, when the economic downturn hit in 2008 I expected the crime rate to increase, but it continued to fall.
Fingers crossed that things continue to improve.

jimmy the one
(2,708 posts)cross posted from another thread: Crime is down -- and so is gun ownership July 23, 2012 By Lauter .. three important trends to keep in mind: Criminal violence in America has dropped to levels not seen in more than a generation, the percentage of Americans owning guns is down and public support for gun control measures has plummeted as well.
.. the percentage of Americans who report owning a pistol or shotgun, the weapons most often used in crime, is now down to 1 in 5, about half what it was in the 1970s. Of course, hardened criminals aren’t likely to respond to the GSS survey, so there’s probably some under-reporting going on. But that was true 30 or 40 years ago, too, and isn’t likely to have affected the overall trend.
The major point is that the American “culture of gun ownership” has been strikingly on the wane for the past generation. A similar decline has taken place in the number of Americans who hunt, now about 5% of the population. With a decline in the percentage of Americans who own guns and the percentage who hunt, one might have expected support for gun control to go up. http://articles.latimes.com/2012/jul/23/news/la-pn-crime-is-down-and-so-is-gun-ownership-20120722
(jto wrote): Note how the percentage of firearms involved in homicides decreased from 1993 thru 2000, from approx. 71% down to 64%, about a 10% decline, statistically significant. This is the same time period that household & personal firearm ownership declined 20 -30% accd'g to GSS, gallup, & Pew.
From 2002 thru 2011 the FA% remained fairly level, avg'g about 68%, an avg decline from 1993/4 of about 5%, not that statistically significant except that, if so, one would've expected a fluctuation above the 1993/4 rate, and there wasn't any.
Percent of violence {homicide} involving a firearm, 1993–2011
1993 .. 71.2 % 1994 ...71.4
1995 ...69.0
1996 ...68.0
1997 ...68.0
1998 ...65.9
1999 ...64.1
2000 ...64.4 .. 2001 ...55.9 ... scratch, 9/11 included ~3,000
2002 ...67.1 2003 ...67.2 2004 ...67.0 2005 ...68.2 2006 ...68.9
2007 ...68.8 2008 ...68.3 2009 ...68.4 2010 ...68.1
2011c ..69.6 http://www.democraticunderground.com/1172151328
I will likely not be able to reply to any replies for several weeks or longer.
kioa
(295 posts)Thanks for the assist, Jimmy.
kioa: Your post shows that gun ownership has increased during the exact same timeframe the OP shows that murders decreased
... the percentage of firearms involved in homicides decreased from 1993 thru 2000, from approx. 71% down to 64%, about a 10% decline, statistically significant. This is the same time period that household & personal firearm ownership declined 20 -30% accd'g to GSS, gallup, & Pew.
Ergo, as gun ownership rates declined, so did homicide rates. Even in Chicago murder rates went down 50%, ~92 - ~2012.
Homicide is just a percent or two of overall violent crime: Crime is down -- and so is gun ownership July 23, 2012.. three important trends to keep in mind: Criminal violence in America has dropped to levels not seen in more than a generation, the percentage of Americans owning guns is down and public support for gun control measures has plummeted as well.
.. the percentage of Americans who report owning a pistol or shotgun, the weapons most often used in crime, is now down to 1 in 5, about half what it was in the 1970s.
The major point is that the American “culture of gun ownership” has been strikingly on the wane for the past generation. http://articles.latimes.com/2012/jul/23/news/la-pn-crime-is-down-and-so-is-gun-ownership-20120722
benEzra
(12,148 posts)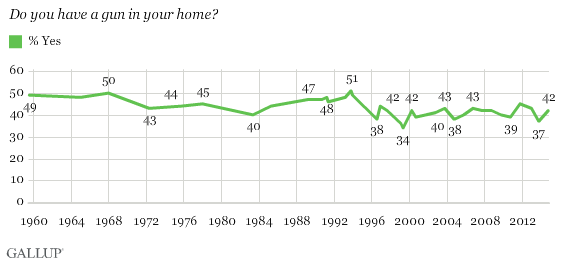
http://www.gallup.com/poll/1645/Guns.aspx
What does change on short time scales is the willingness of gun owners to discuss a very private matter with some stranger who cold-calls you on the phone, claims to be taking a survey, and asks you if you own guns. Look at the two data points on opposite sides of the 1994 gun-control debacle; a thirteen point drop in one survey, and then back up to 42% where it's been for more than a decade now.
That doesn't mean that fifteen million households sold all their guns (or lost them in tragic boating accidents) in 1994 and then eight or ten million households bought them back a couple years later. What it demonstrates is that the more hostile the climate, the less inclined gun owners are to tell some random caller about what valuables they own and how they store them. I'm one of them; I talk about gun ownership here where I am relatively anonymous, but I damn sure won't tell some caller I don't personally know.
One thing some people also forget when looking at rates is that there are way more households than there used to be per capita, so the fact that per-household ownership rate is holding steady is actually growth in absolute numbers, as you know.
jimmy the one
(2,708 posts)ezra: gun ownership has been steady since the mid-1990s, while murders decreased 50%.
You're compressing; household & personal gun ownership rates dropped from 1993 to 2000, even accd'g to your gallup link, & FA violent crime & murder rates also dropped.
The sharpest decline in HH gun ownership rates was from ~1993 to 2000 - gallup has it dropping from ~50% to 34% (99) & 42% (2000). Note how violent crime rates (& totals) dropped the most during that very time period of 8 years, then fluctuated slightly from 2000 - 2008 as HHGO rates leveled off. The two charts (gallup HHGO & FA violent crime rates) show a correlation (murder rates in next post).
From a firearm related violent crime rate high of 9.2% & 9.3% in 1993 & 94 - as HH gun ownership rates declined - the FA related violent crime rate also declined steadily to 1999, then fell to a low of 6.2% & 6.0% in 2003 & 2008. That's from a 25% to 33% decline. From 2008 to now evidently FA related violent crime rate rose back up, post Obama or Heller, I pick heller.
Bur justice stats, may 2013 (NFFAV = non fatal firearm violence);
.. total FA VC.. FA hom ..non fatals .. NF incidents..NFFAV ..All viol w FA's
1993 1,548,000 18,253 1,529,700 1,222,700 7.3 9.2%
1994 1,585,700 17,527 1,568,200 1,287,200 7.4 9.3
1995 1,208,800 15,551 1,193,200 1,028,900 5.5 7.9
1996 1,114,800 14,037 1,100,800 939,500 5.1 7.9
1997 1,037,300 13,252 1,024,100 882,900 4.7 7.7
...1998 847,200 11,798 835,400 673,300 3.8 7.0
...1999 651,700 10,828 640,900 523,600 2.9 6.1
...2000 621,000 10,801 610,200 483,700 2.7 7.3
...2001 574,500 11,348 563,100 507,000 2.5 7.7
...2002 551,800 11,829 540,000 450,800 2.3 7.4
...2003 479,300 11,920 467,300 385,000 2.0 6.2
...2004 468,100 11,624 456,500 405,800 1.9 6.9
...2005 515,900 12,352 503,500 446,400 2.1 7.4
...2006 627,200 12,791 614,400 552,000 2.5 7.4
...2007 567,400 12,632 554,800 448,400 2.2 8.3
...2008 383,500 12,179 371,300 331,600 1.5 6.0
...2009 421,600 11,493 410,100 383,400 1.6 7.4
...2010 426,100 11,078 415,000 378,800 1.6 8.6
..2011d 478,400 11,101 467,300 414,600 1.8 8.2 http://www.bjs.gov/content/pub/pdf/fv9311.pdf
Highlighting the last two columns. Note the dramatic drop of nearly one million crimes in FA violent crime totals from 1993 to 2000 (1.55 million to 0.62 million), while as HHGO rates leveled off 2000 - 2011 there was a much less drop of 0.2 million. Note the dramatic drop in total murder from 1993 to 2000 (above chart), from 18,000 to 11,000:
*(category in table below): Rate of nonfatal firearm victimization
..Fatal & Non Fatal FA Viol ... *above .... rate of violence w firearms
1993 1,548,000 ................ 7.3 ....................9.2%
1994 1,585,700 ................ 7.4 ......................9.3
1995 1,208,800 ................ 5.5 ......................7.9
1996 1,114,800 ................ 5.1 ......................7.9
1997 1,037,300 ................ 4.7 .......................7.7
...1998 847,200 ............... 3.8 .......................7.0
...1999 651,700 ............... 2.9 .......................6.1
...2000 621,000 ............... 2.7 .......................7.3
...2001 574,500 ............... 2.5 .......................7.7
...2002 551,800 ............... 2.3 ........................7.4
...2003 479,300 ............... 2.0 ........................6.2
...2004 468,100 ............... 1.9 ........................6.9
...2005 515,900 .............. 2.1 .........................7.4
...2006 627,200 .............. 2.5 .........................7.4
...2007 567,400 .............. 2.2 .........................8.3
...2008 383,500 .............. 1.5 .........................6.0
...2009 421,600 .............. 1.6......................... 7.4
...2010 426,100 .............. 1.6 .........................8.6
..2011d 478,400 .............. 1.8 ........................8.2
jimmy the one
(2,708 posts)Again, noting the drop in HH & personal gun ownership rates from 1993 - 2000 - 2011, readers will see the correlation with the drop in murder as a percentage involving a firearm from 1993 - 2000, then a leveling off (w slight increase) as HH gun ownership rates leveled off from 2000 - 2011. It's an uncanny correlation imo.
Percent of violence {homicide} involving a firearm, 1993–2011
1993 .. 71.2%
1994 ...71.4
1995 ...69.0
1996 ...68.0
1997 ...68.0
1998 ...65.9
1999 ...64.1
2000 ...64.4
2001 ...55.9 ... scratch, 9/11 included ~3,000
2002 ...67.1
2003 ...67.2
2004 ...67.0
2005 ...68.2
2006 ...68.9
2007 ...68.8
2008 ...68.3
2009 ...68.4
2010 ...68.1
2011c ..69.6 http://www.bjs.gov/content/pub/pdf/fv9311.pdf
kioa
(295 posts)California 21.3% gun ownership. Murder rate 4.6
New Jersey 12.3% ownership. Murder rate 4.5
Texas 35.9% gun ownership. Murder rate 4.3
Wyoming 59.7% ownership. Murder rate 2.9
Iowa 42.9% ownership. Murder rate 1.4
27 states have both higher guns per capita & lower murder rates than California & New Jersey.
It seems your thesis needs some work.
http://www.deathpenaltyinfo.org/murder-rates-nationally-and-state#MRord
http://usliberals.about.com/od/Election2012Factors/a/Gun-Owners-As-Percentage-Of-Each-States-Population.htm
jimmy the one
(2,708 posts)kioa: 27 states have both higher guns per capita & lower murder rates than California & New Jersey.
It seems your thesis needs some work.
http://www.deathpenaltyinfo.org/murder-rates-nationally-and-state#MRord
You then proceeded to show, by your link, that of the 20 states with higher murder rates in 2013 than California, 16 of them are pro gun states, only Alaska with a small population. Actually only one has stricter gun control, maryland, while Michigan, new mex, & Illinois are about neutral these days, not really pro gun despite having shall issue.
Furthermore, when citing California vs much smaller populated states, you are comparing apples to oranges, since California has several large urbanized cities LA, SF, san diego, Oakland, with large population densities like 20,000 per sq mile, non-existent in many of the smaller progun redstates - apples to oranges.
The best way to compare California, is with only 3 other comparable states, new York, florida, & texas, somewhat conveniently two pro gun, two gun control. 2013 stats:
Florida murder rate. .. 5.0 ... gun ownership rate 24.5% (due in part retirees)
California murder rate 4.6 .... ....................... 21.3
Texas murder rate .... 4.3 ............................. 36
New York murd rate.. 3.3 ...............................18
-- so calif/ny 3.95 avg edges out texas/flor 4.65
It seems your counter-thesis needs work.
kioa
(295 posts)Thanks for the assist, big-guy.
Response to kioa (Reply #21)
friendly_iconoclast This message was self-deleted by its author.
friendly_iconoclast
(15,333 posts)And Texas has more people than New York State and Florida, with "several large urbanized cities"
(Houston, Dallas, San Antonio, Austin, Fort Worth, El Paso)
"with large population densities"
I have a sneaking suspicion that our interlocutor is engaging in some sort of
Kaufmanesque roleplay...
jimmy the one
(2,708 posts)icon: And Texas has more people than New York State and Florida, with "several large urbanized cities"
(Houston, Dallas, San Antonio, Austin, Fort Worth, El Paso) "with large population densities"
So what's your point this time? gun control New York has ~25% lower murder rate with half the gun ownership rate, than texas;
Pro gun Texas only has ~6% lower murder rate than gun control California which has ~9% lower murder rate than pro gun florida.
Texas has 20.8 million in 2010 census, while new York has 19.0, that's called parity jack, for comparison purposes.
California has 34 mill, florida 16 mill, the next in line Illinois with 13 million.
What's your point jack?
icon: I have a sneaking suspicion that our interlocutor is engaging in some sort of Kaufmanesque roleplay...
I have a sneaking suspicion you're not playing with a full deck of cards.
what I originally wrote: The best way to compare California, is with only 3 other comparable states, new York, florida, & texas, somewhat conveniently two pro gun, two gun control. 2013 stats:
Florida murder rate. .. 5.0 ... gun ownership rate 24.5% (due in part retirees)
California murder rate 4.6 .... ....................... 21.3
Texas murder rate .... 4.3 ............................. 36
New York murd rate.. 3.3 ...............................18
-- so calif/ny 3.95 avg edges out texas/flor 4.65
friendly_iconoclast
(15,333 posts)You know, the one where you've been stoutly defending the notion that
"more guns=more crime?
For those unfamiliar, start here and read down:
http://www.democraticunderground.com/1172156018#post36
Why isn't it lower still, say ~50% lower ? After all, fewer guns...
Isn't that unpossible, according to you? Shouldn't the Texas murder rate be about
50% higher than California's? After all, more guns...
blueridge3210
(1,401 posts)What's with the Ad Hominem attack, Jimmy?
jimmy the one
(2,708 posts)blueridge: What's with the Ad Hominem attack, Jimmy?
You take it out of context, where it was a parry:
icon: I have a sneaking suspicion that our interlocutor is engaging in some sort of Kaufmanesque roleplay...
jimmy wrote: I have a sneaking suspicion you're not playing with a full deck of cards.
Maybe you too blueridge.
blueridge3210
(1,401 posts)Stay classy, buddy.
NYC_SKP
(68,644 posts)What you have are errors in data collection, poor methodologies, and people who refuse to self report.
More guns sold, more guns per capita, gun ownership is unlikely to have markedly changed.


AtheistCrusader
(33,982 posts)Lurks Often
(5,455 posts)but I keep being told that more guns = more crime.
Seems some that post here ignore unpleasant facts that don't fit their agenda. Such dishonesty!
jimmy the one
(2,708 posts)lurks often: How odd, crime is down while firearms sales reached all time highs
Firearms sales are high, but moreso to existing gun owners. The 'guns per capita' stat (or slt, maybe for adults, dunno) has increased from approx. 5 up to approx. 6.5 - a ~33% increase, which means you aren't getting new gun owners at a rate to keep up gun ownership rates, that is what has fallen.
but I keep being told that more guns = more crime.
More gun ownership rates appears to hold true with more crime & guncrime rates.
Seems some that post here ignore unpleasant facts that don't fit their agenda. Such dishonesty
Indeed. You are well aware of what I've just posted, it's been bandied about several times the last couple months.
When you just repeat the same false allegations --as you say, such dishonesty.
friendly_iconoclast
(15,333 posts)I daresay that those that believed it then still believe it now.
Why, you might even *be* one of those people!
Eleanors38
(18,318 posts)I still wait for an uptick, let alone an upward trend, in homicides, but am delighted to see the surprising downward trend continue. Some point to ageing trends as the reason for declines, just as some see similar trends in future elections. Perhaps. But the political theory of mass extinction is too simplistic, blundering its way into numerous socia explanations. I think other factors are at play.
For what it's worth, most in-the-know folks I talk to automatically believe crime rates are going up, maybe because bleeds-it-leads "journalism" is so dominant.
Logical
(22,457 posts)so no need to further restrict gun sales.
If a criminal wants a gun they can get one.

melm00se
(4,984 posts)Logical
(22,457 posts)what point you are trying to make. If any.
Logical
(22,457 posts)You might want to self delete your post.
http://www.usatoday.com/story/news/nation/2013/06/17/atf-firearms-lost-stolen/2432447/
ATF report: 190,000 firearms lost or stolen in 2012
The audit, ordered by the Obama administration in the aftermath of the December Connecticut school massacre, is the first such public accounting by the ATF.
The overwhelming majority —183,660 — were stolen guns. That number is up from 145,300 firearms reported stolen in 2010, according to a separate 2012 review by the Bureau of Justice Statics' National Crime Victims Survey.
However, the Bureau of Justice Statistics' survey found that firearm thefts, like overall thefts, have been declining for much of the past decade.