Environment & Energy
Related: About this forumArctic Heat Digs In; Beaufort Temps 10-15C Above Avg; Ice Extent Collapsing Below 11.5 Million Km2
EDIT
This week, a huge pulse of warm air rose up over Northwest Canada and Alaska. Invading the Beaufort, it drove a broad warm front which forced near or above freezing temperatures over between 1/4 to 1/3 of the Arctic Ocean zone. Regions from the East Siberian Sea, through the Chukchi, into the Beaufort, and including a chunk of the polar zone above the 80th parallel all experienced these anomalously warm readings. By Friday, air temperature anomalies in the entire Arctic zone above 66 North were about 3 C above average and in a large section of the hot zone centered on the Beaufort temperatures ranged between 10-15 C above average. For the Arctic, it appeared that June had arrived a month early.
 ?w=900&h=698
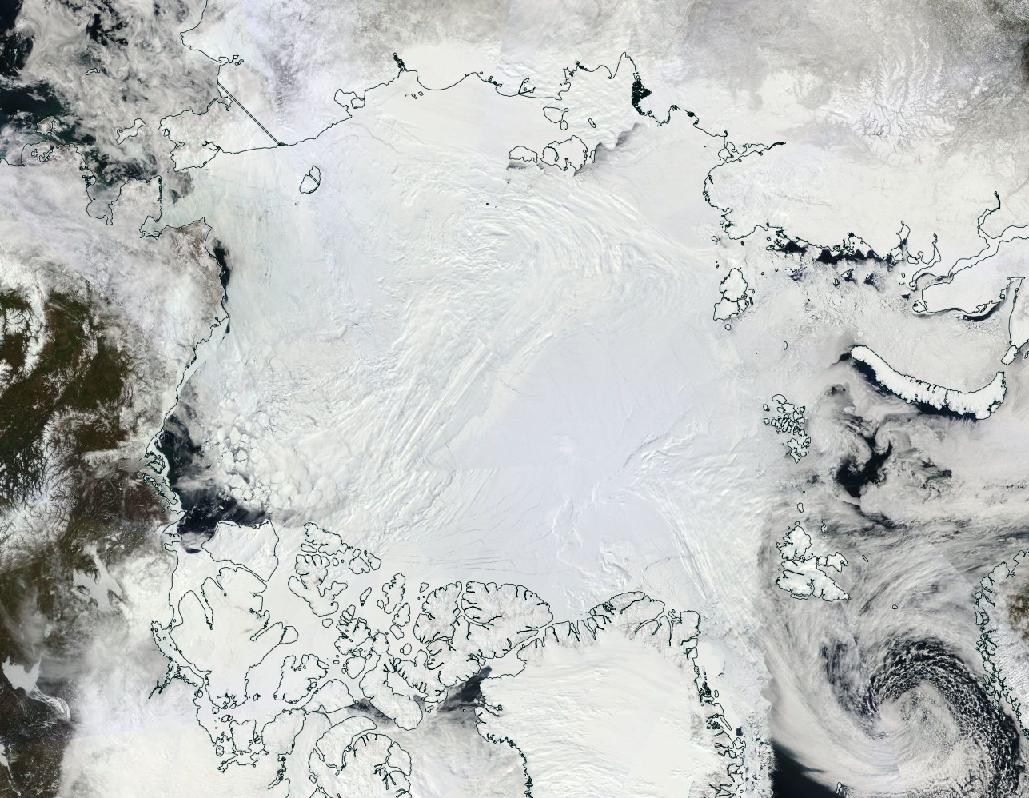
(Abundant Arctic snow and sea ice melt on May 12 provides a visible record of a region compromised by the heat of human-forced climate change. Large land regions — such as Northwest Canada and Alaska — snow free when they should not be. And larger regions of open water appear in the zones that were traditionally covered by sea ice. A bluing over the Chukchi and Beaufort is also indicative of melt pond proliferation. Summer, it appears, has come to the Arctic far too early. Image source: LANCE-MODIS.)
The effect of all this heat — just the latest hot flare during a record warm 2016 — on the sea ice has been tremendous. Huge areas of dark, ice-free water have opened up. The Bering is practically ice free. The Chukchi is plagued with thin ice, large polynyas, and melt ponds. Baffin Bay and the Barents are greatly reduced. And in the Beaufort a massive 120 to 200 mile wide region of open water continues to expand.
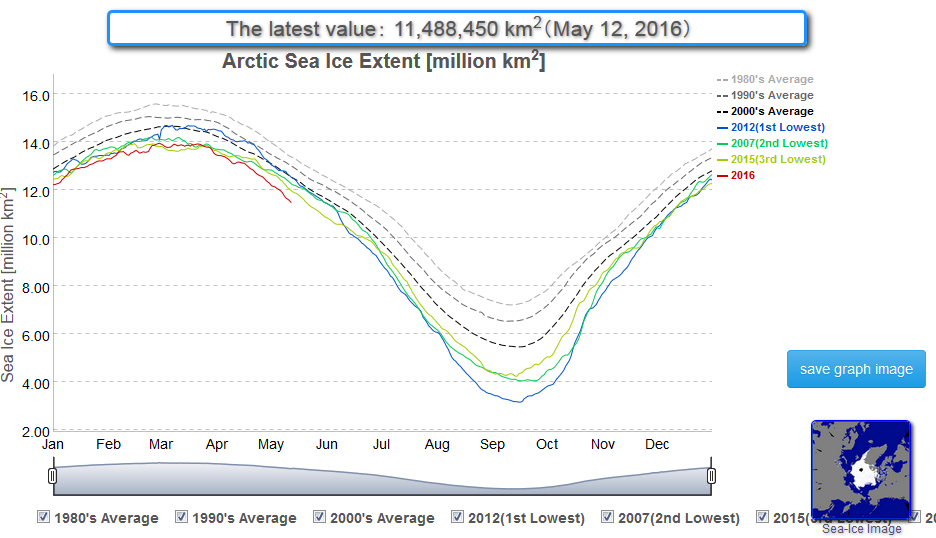
Pretty much all the major monitors now show Arctic sea ice plummeting deep into record low ranges. The JAXA extent measure yesterday rocketed past the 11.5 million square kilometer mark with barely a blink following multiple days of 100,000 square kilometer losses. DMI looks like the bottom dropped out of its own extent and volume measures. And NSIDC shows Arctic sea ice extent levels widening the gap from previous record lows for this time of year.
 ?w=900&h=518
(2016 Actic sea ice — indicated by the red line in the JAXA monitor above — continues its record plunge. Record Arctic heat during 2016 has driven a never-before-seen rate of melt for the first four and a half months of this year. If such melt rates continue, there will be very little sea ice left by melt season end in September. Image source: JAXA.)
Overall, not only is the sea ice less extensive and thinner than it has ever been for this time of year, but the rates of loss it is now experiencing are more similar to those that would typically be seen during June and July — not May. In such a context of record heat and melt, current new sea ice extent lows are about 9-10 days ahead of the previous record low, 22-24 days ahead of the 2000s average line, more than a month ahead of the 1990s average line, and fully a month and a half ahead of the 1980s average line. In other words, there is something seriously, seriously wrong with the polar region of our world.
EDIT
https://robertscribbler.com/2016/05/13/polar-heatwave-digs-in-as-arctic-sea-ice-crashes-blue-ocean-event-looking-more-and-more-likely/
 = new reply since forum marked as read
Highlight:
NoneDon't highlight anything
5 newestHighlight 5 most recent replies
= new reply since forum marked as read
Highlight:
NoneDon't highlight anything
5 newestHighlight 5 most recent replies
truebrit71
(20,805 posts)
emmadoggy
(2,142 posts)Meanwhile, no one seems to care (or even be aware).
sue4e3
(731 posts)I go to NSIDC and thier latest chartic graph show 12.172 km . Am I missing something
http://nsidc.org/arcticseaicenews/charctic-interactive-sea-ice-graph/

hatrack
(59,578 posts). . . . and while they're working to compensate with instruments from other platforms, they've advised that things may be a bit hinky, at least short-term.
sue4e3
(731 posts)hatrack
(59,578 posts). . . and are also using data from one of the Japan Meteorological Organization's birds.
sue4e3
(731 posts)sue4e3
(731 posts)GliderGuider
(21,088 posts)[center]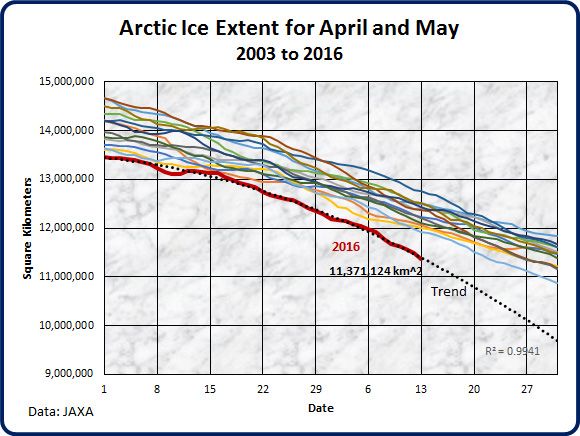
To May 13, 2016[/center]
The current 6-week trend implies a possible loss of 1.5 million km^2 over the next two weeks. Let see what the curve actually does as the month plays out.

XemaSab
(60,212 posts)

GliderGuider
(21,088 posts)This could be it. We'll see.